Soil Service Life Chart Guide
Last Updated: November 2026
This guideline provides information and instructions for using the Service Life of Galvanized Steel Articles in Soil Applications charts. Service life is defined as time to complete consumption of the galvanized coating. The charts provide a practical starting point for evaluating HDG coating life and are most useful as screening and design planning tools. In many cases, experience with similar soil types in other applications is the most reliable indication of likely performance.
Development of Charts
The primary source for information on the performance of galvanized steel articles in soil conditions was the Conditions and Corrosion Survey on Corrugated Steel Storm Sewer and Culvert Pipe: Final Report prepared by Corrpro Companies for the National Corrugated Steel Pipe Association (NCSPA) in cooperation with the American Iron and Steel Institute (AISI).
The study examined material from 122 U.S. sites with conditions varying from a low pH of 4.1 to a high pH of 10.3. This data led to the creation of a database for a statistical model. Measurements of soil chloride content, resistivity to moisture, and pH were taken to develop the model to predict corrosion rates. The model was developed to accurately predict the average service life of hot-dip galvanized steel based on the measured corrosion rate and initial thickness of the coating.
The condition of the galvanized coating was evaluated by simple pipe-to-soil potential measurements using a copper-copper sulfate reference electrode.
The data from Corrpro Studies determined the service life of 16 gauge corrugate steel pipe to be twice the number of years to first perforation. However, for structural hot-dip galvanized steel, it is more appropriate to define service life as the time to total consumption of the coating plus an extra 25% of the estimated time. As there are many factors which affect corrosion rate, this definition of service life provides a guideline for estimating the time when the zinc coating has been surpassed and the steel corrosion is to the point where a loss in structural integrity will begin. This model is therefore used to produce these charts.
Obtaining Data
There are many ways to estimate what soil condition exposure the galvanized coating experiences in the ground. For example, previous experience in an area could be a good reference for predicting corrosion rates of galvanized steel. However, soil conditions are subject to change quite dramatically within relatively small distances so this may not be completely effective.
You may also be able to estimate the performance of galvanized steel based on the soil type. For example, galvanized steel tends to perform better in brown sandy soils than it does in gray clay-like soils. However, this information is essentially anecdotal in nature and should not be used as an estimation method.
To obtain a practical estimate, measurements of chloride content, moisture content, and soil pH should be taken and used with one of the four charts found in the AGA's Service Life of Galvanized Steel Articles in Soil Applications. These parameters are commonly obtained from a project geotechnical report.
Chloride Content
The most corrosive ion to metals found in soil is chlorides. Their presence may be due to the soils presence in a coastal environment, or from outside sources such as de-icing salts. The chloride concentration of soil can be found by taking a water extract from the soil, measuring the chloride concentration of the extract per ASTM D512 Standard Test Methods for Chloride Ion In Water, then calculating the chloride ion concentration in the original soil volume. The concentration can be found in parts per million (ppm):

Moisture Content
Three sources of water (ground, gravitational, and capillary) contribute to the moisture content of soil. Soils with a higher moisture content are generally more corrosive to galvanized steel than lower moisture soils. The moisture content can be found by using the weigh-bake-weigh method found in ASTM D2216 Standard Test Methods for Laboratory Determination of Water (Moisture) Content of Soil and Rock by Mass.
pH
The soil can be relatively described as acidic (pH<7), neutral (pH=7), or alkaline (pH>7). Generally, more neutral soils (pH equal to or near 7) are less corrosive to galvanized steel. Testing for soil pH should be done in a laboratory setting following the procedures outlined in ASTM G51 Standard Test Method for Measuring pH of Soil for Use in Corrosion Testing. The test includes mixing a soil sample with distilled water and measuring the pH of the mixed sample.
A Note About Resistivity
We are often asked why soil resistivity is not a variable listed in the AGA’s soil charts. In short, there is not a direct link between soil resistivity and HDG corrosion rate and resistivity alone is not sufficient to characterize soil corrosivity. Soil resistivity is instead considered a secondary parameter. Padilla (2014) discusses these reasons in detail.
Padilla, V., Ghods, P., and Alfantazi, A. “Parametric Studies and Application of a Practical Model for Corrosion of Galvanized Steel in Soil.” Corrosion, Vol. 70, No. 12, 2014.
Determining Which Chart to Use
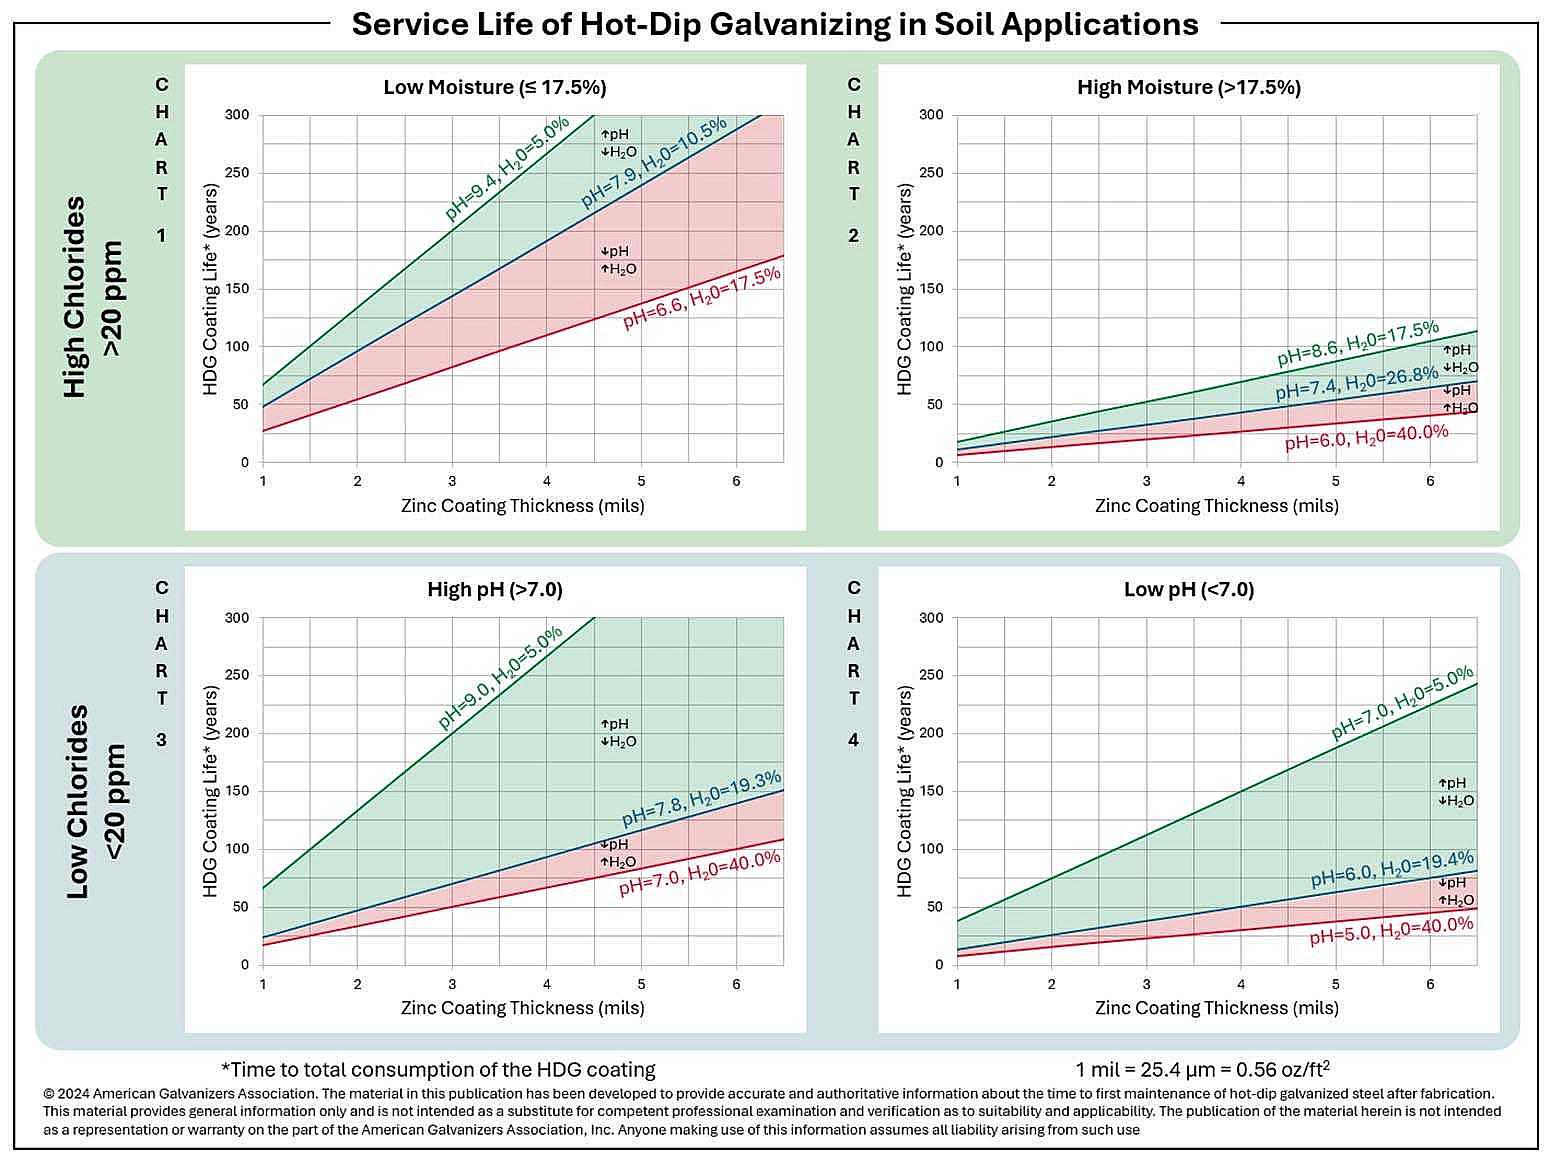
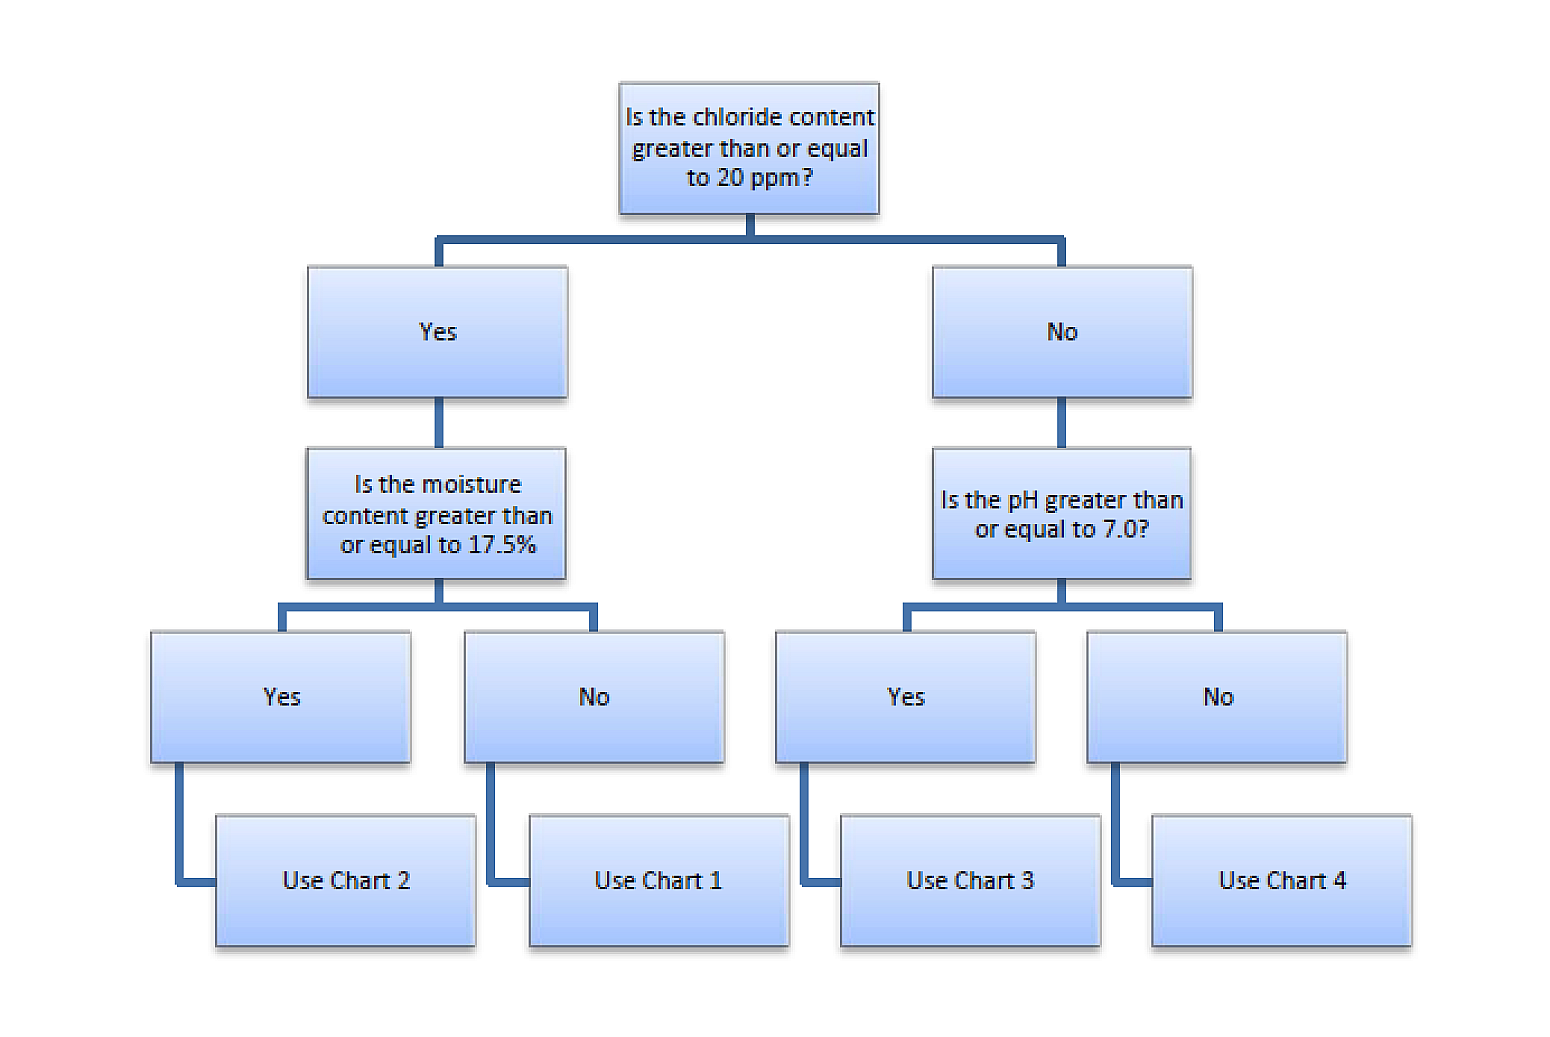
After the information of chloride content, moisture content, and pH of the soil in the area of the buried galvanized steel are found, a prediction of service life based on the thickness of the galvanized coating can be found in one of the four charts in Figure 1. Which chart to use depends on factors such as high or low chloride content, high or low moisture content, and high or low pH. The flowchart shown in Figure 2 goes through the process of determining which chart should be used for a prediction by asking simple questions about the parameter values.
Using the Chart
After determining the applicable chart category, the service life of galvanized steel in the tested soil can be estimated from the proper chart.
Because coating thickness is directly proportional to service life, clearly state the assumed galvanized coating thickness as determined using the applicable galvanizing specification such as ASTM A123/A123M. To address uncertainty in an assessment, a thicker galvanized coating can be specified if the viability of a thicker coating has been evaluated and agreed with the manufacturer/galvanizer.
Next, estimate service life defined as time to total consumption of the galvanized coating:
- The center blue line on each chart represents the average of all locations covered by each chart. Each blue line is indicated with a pH value and moisture content for accuracy.
- The green area represents the soil conditions that have greater service life than the average, and how the changes in pH and moisture content affect the estimated service life. The green line represents the condition with the lowest corrosion rate in the dataset used to develop each chart.
- The red area represent conditions less ideal than the average that decrease the service life, and how the changes in pH and moisture content affect the estimated service life. The red line represents the condition with the highest corrosion rate in the dataset used to develop each chart.
Consider these average (blue), high (green), and low (red) field-performance curves as a range. The charts provide a practical basis for estimating zinc coating life when project data fall within the chart categories. Their principal limitation is the natural spread in the underlying field data. The high (green), low (red), and average (blue) curves show the range observed within a soil category; they are not precision boundaries and should not be extrapolated beyond the chart.
When Further Analysis is Needed
Sometimes project conditions fall outside the charts, such as very low pH combined with high moisture or chlorides. For such cases, consider additional site data, a Romanoff similitude analysis performed by a corrosion specialist, project-specific testing, or other strategies.
For Ground-Mounted Solar Structures, additional guidance is available from AGA.