In Soil
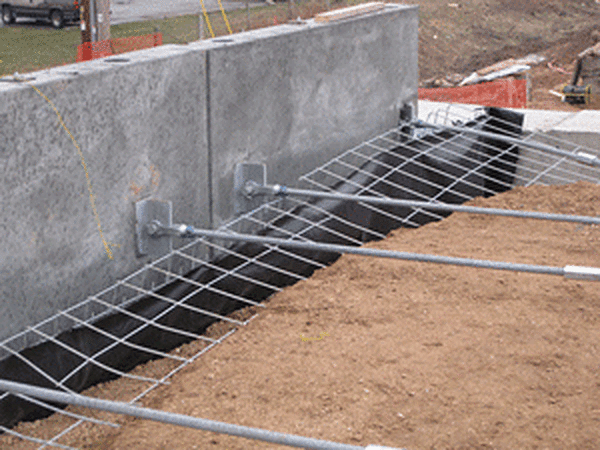
Another common exposure for hot-dip galvanized steel is partially or fully buried in soil. With more than 200 different types of soil identified in North America, hot-dip galvanizings performance in soil is varied and hard to predict. Even in very close proximity, soil conditions can have significant variations.
The main factors that dictate the corrosivity of the soil are moisture content, pH level, and chlorides. These soil conditions are affected by additional characteristics such as aeration, temperature, resistivity, and texture or particle size. A general rule of thumb is galvanizing performs well in brown sandy soils, and not as well in gray, clay-like soils. This is because soil with larger particles wick moisture away from the surface more quickly so the galvanized piece has less exposure to moisture.
The first step to estimating the performance of hot-dip galvanized steel in soil is to classify it. The corrosion rate of steel in soil can range from less than 0.2 microns per year in favorable conditions, to 20 microns per year or more in very aggressive soils. Thus, highly corrosive soils will dictate the need for a reliable corrosion protection system, such as hot-dip galvanizing, to ensure long-term protection.
As soil changes even over a short area, and the corrosivity of the soil can vary greatly, misclassifying the soil can lead to unpredicted performance. The AGA has developed a chart for estimating HDGs performance in soil based on real world corrosion data. In this case, service life is defined as total consumption of the coating plus 25%, and is an indication of when the structure should be replaced.
There are four different (sub) charts based on the classification of the soil. Using the chart (below), the first classification is by chloride content — Charts 1 and 2 (top row) are used for soils with high chlorides (>20 PPM) and Charts 3 and 4 (bottom row) are used for soils with low chlorides (<20 PPM). Once you have identified the chloride content, there is a second classification to determine the correct chart to use. For soils with high chlorides, the second determination would be moisture content. Soils with low moisture (<17.5%) fall on Chart 1, while soils with high moisture (>17.5%) fall on Chart 2. For low chlorides, the second determination is the pH level. Soils with high pH levels (>7.0) fall on Chart 3, while soils with low pH (<7.0) fall on Chart 4.
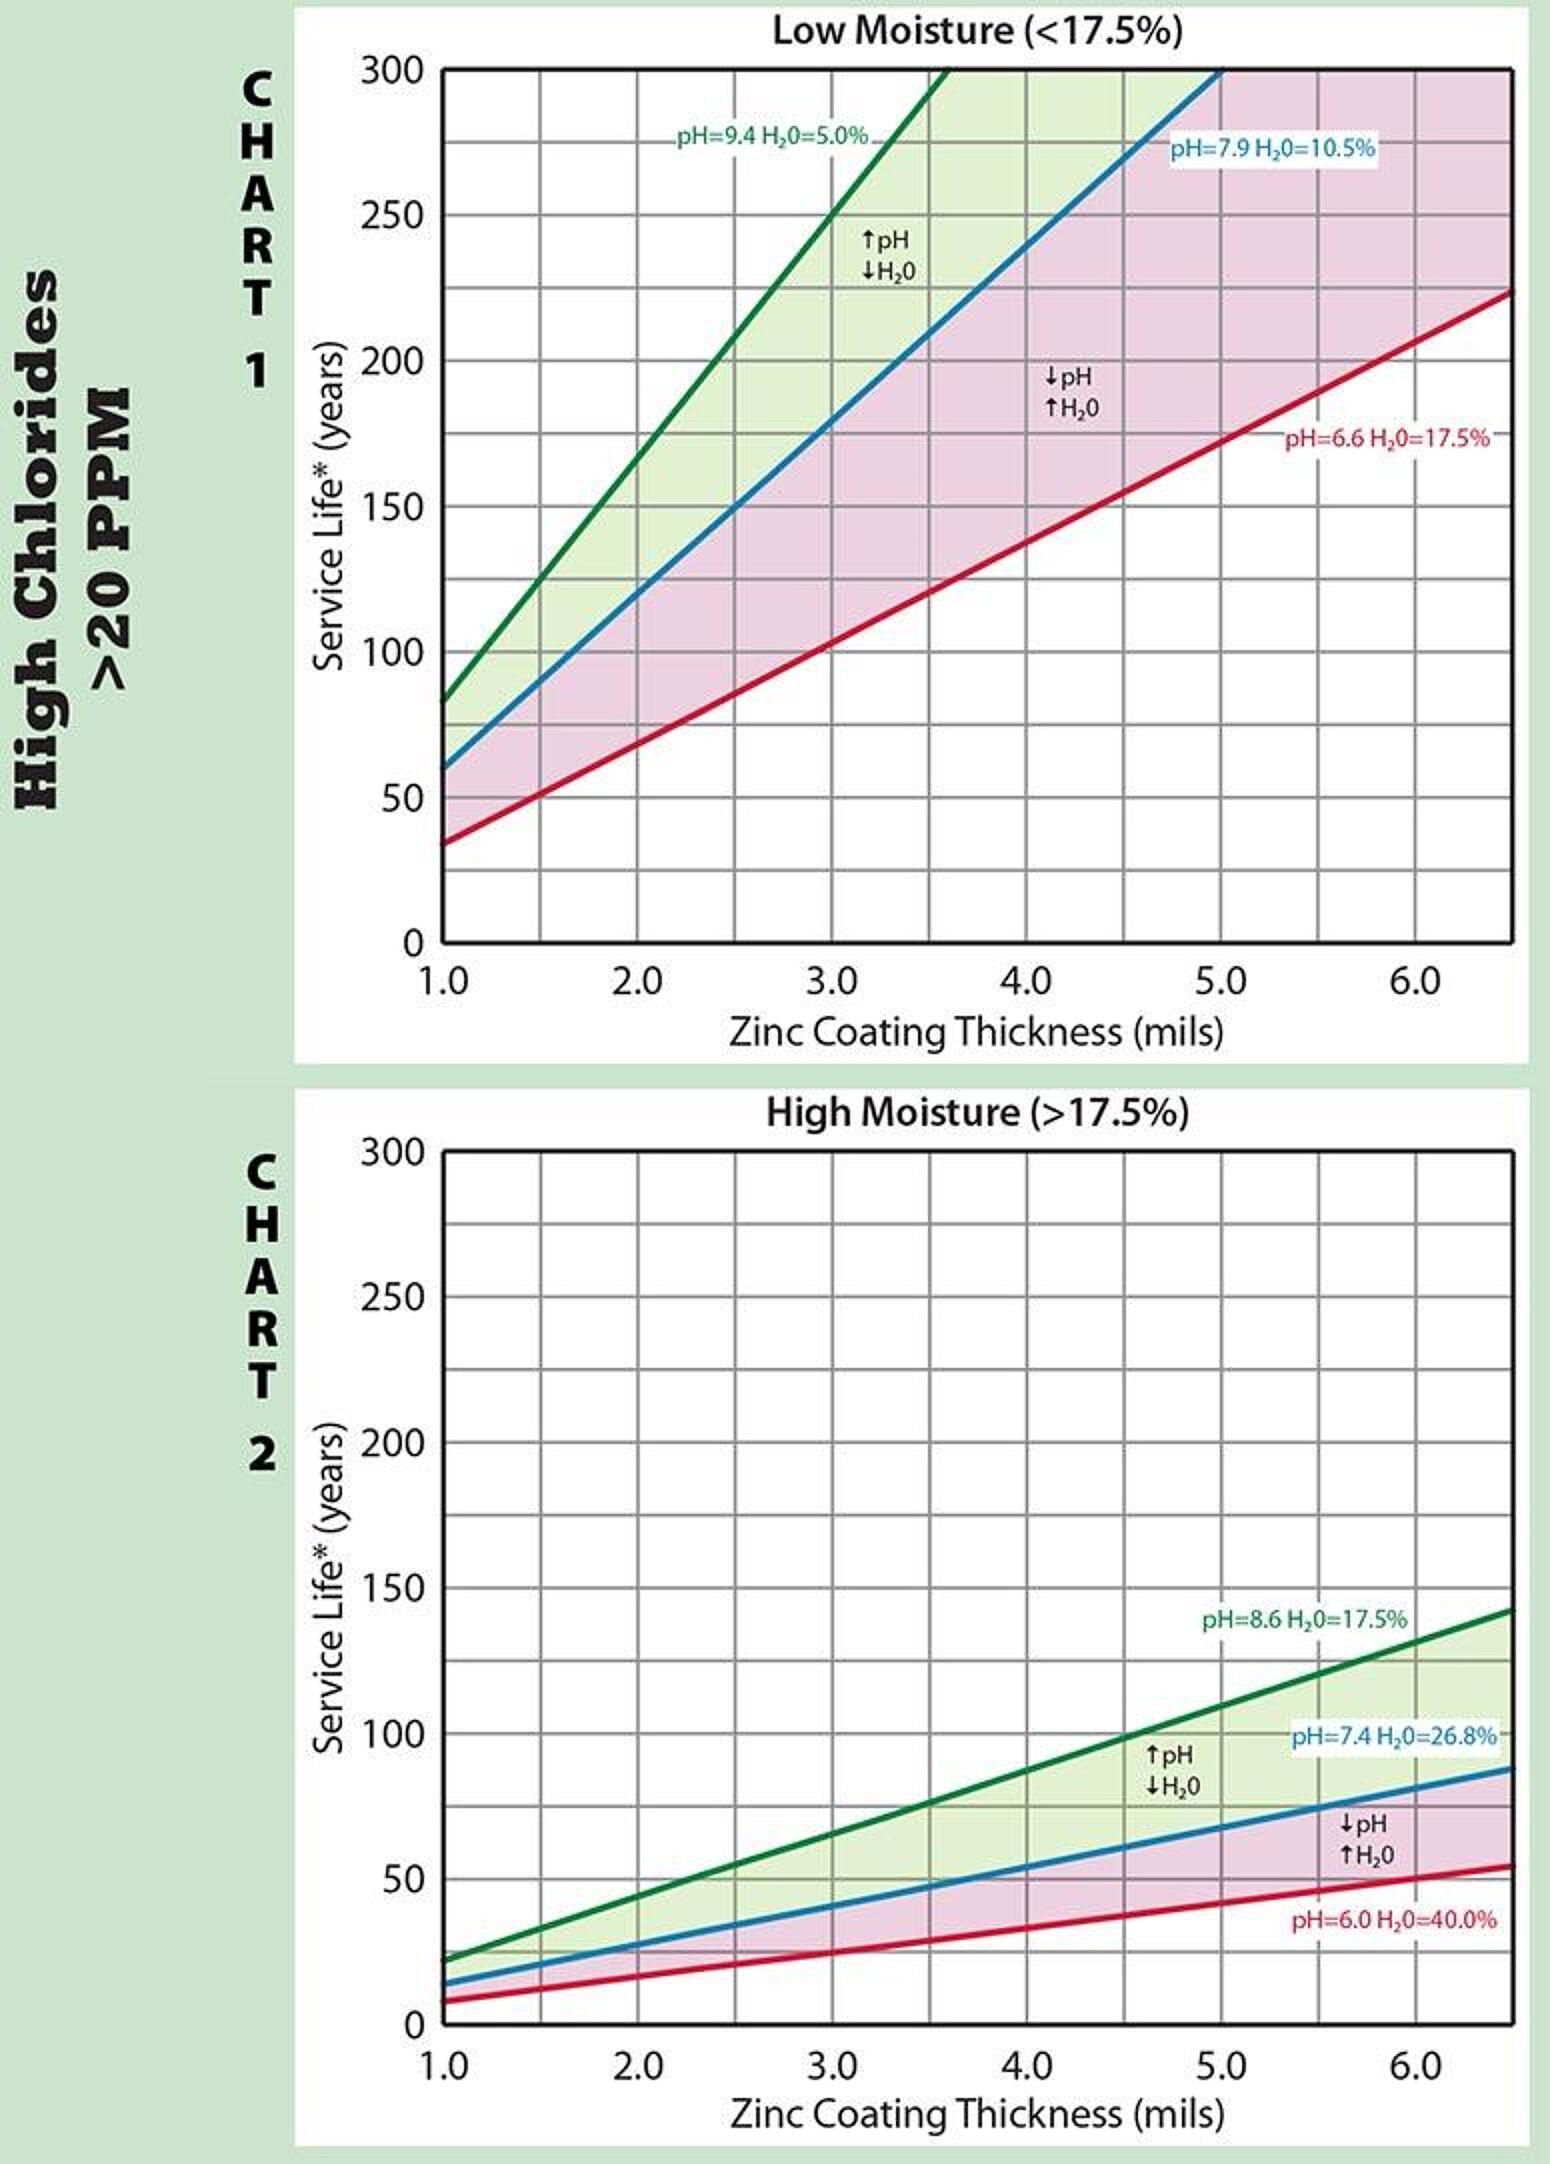
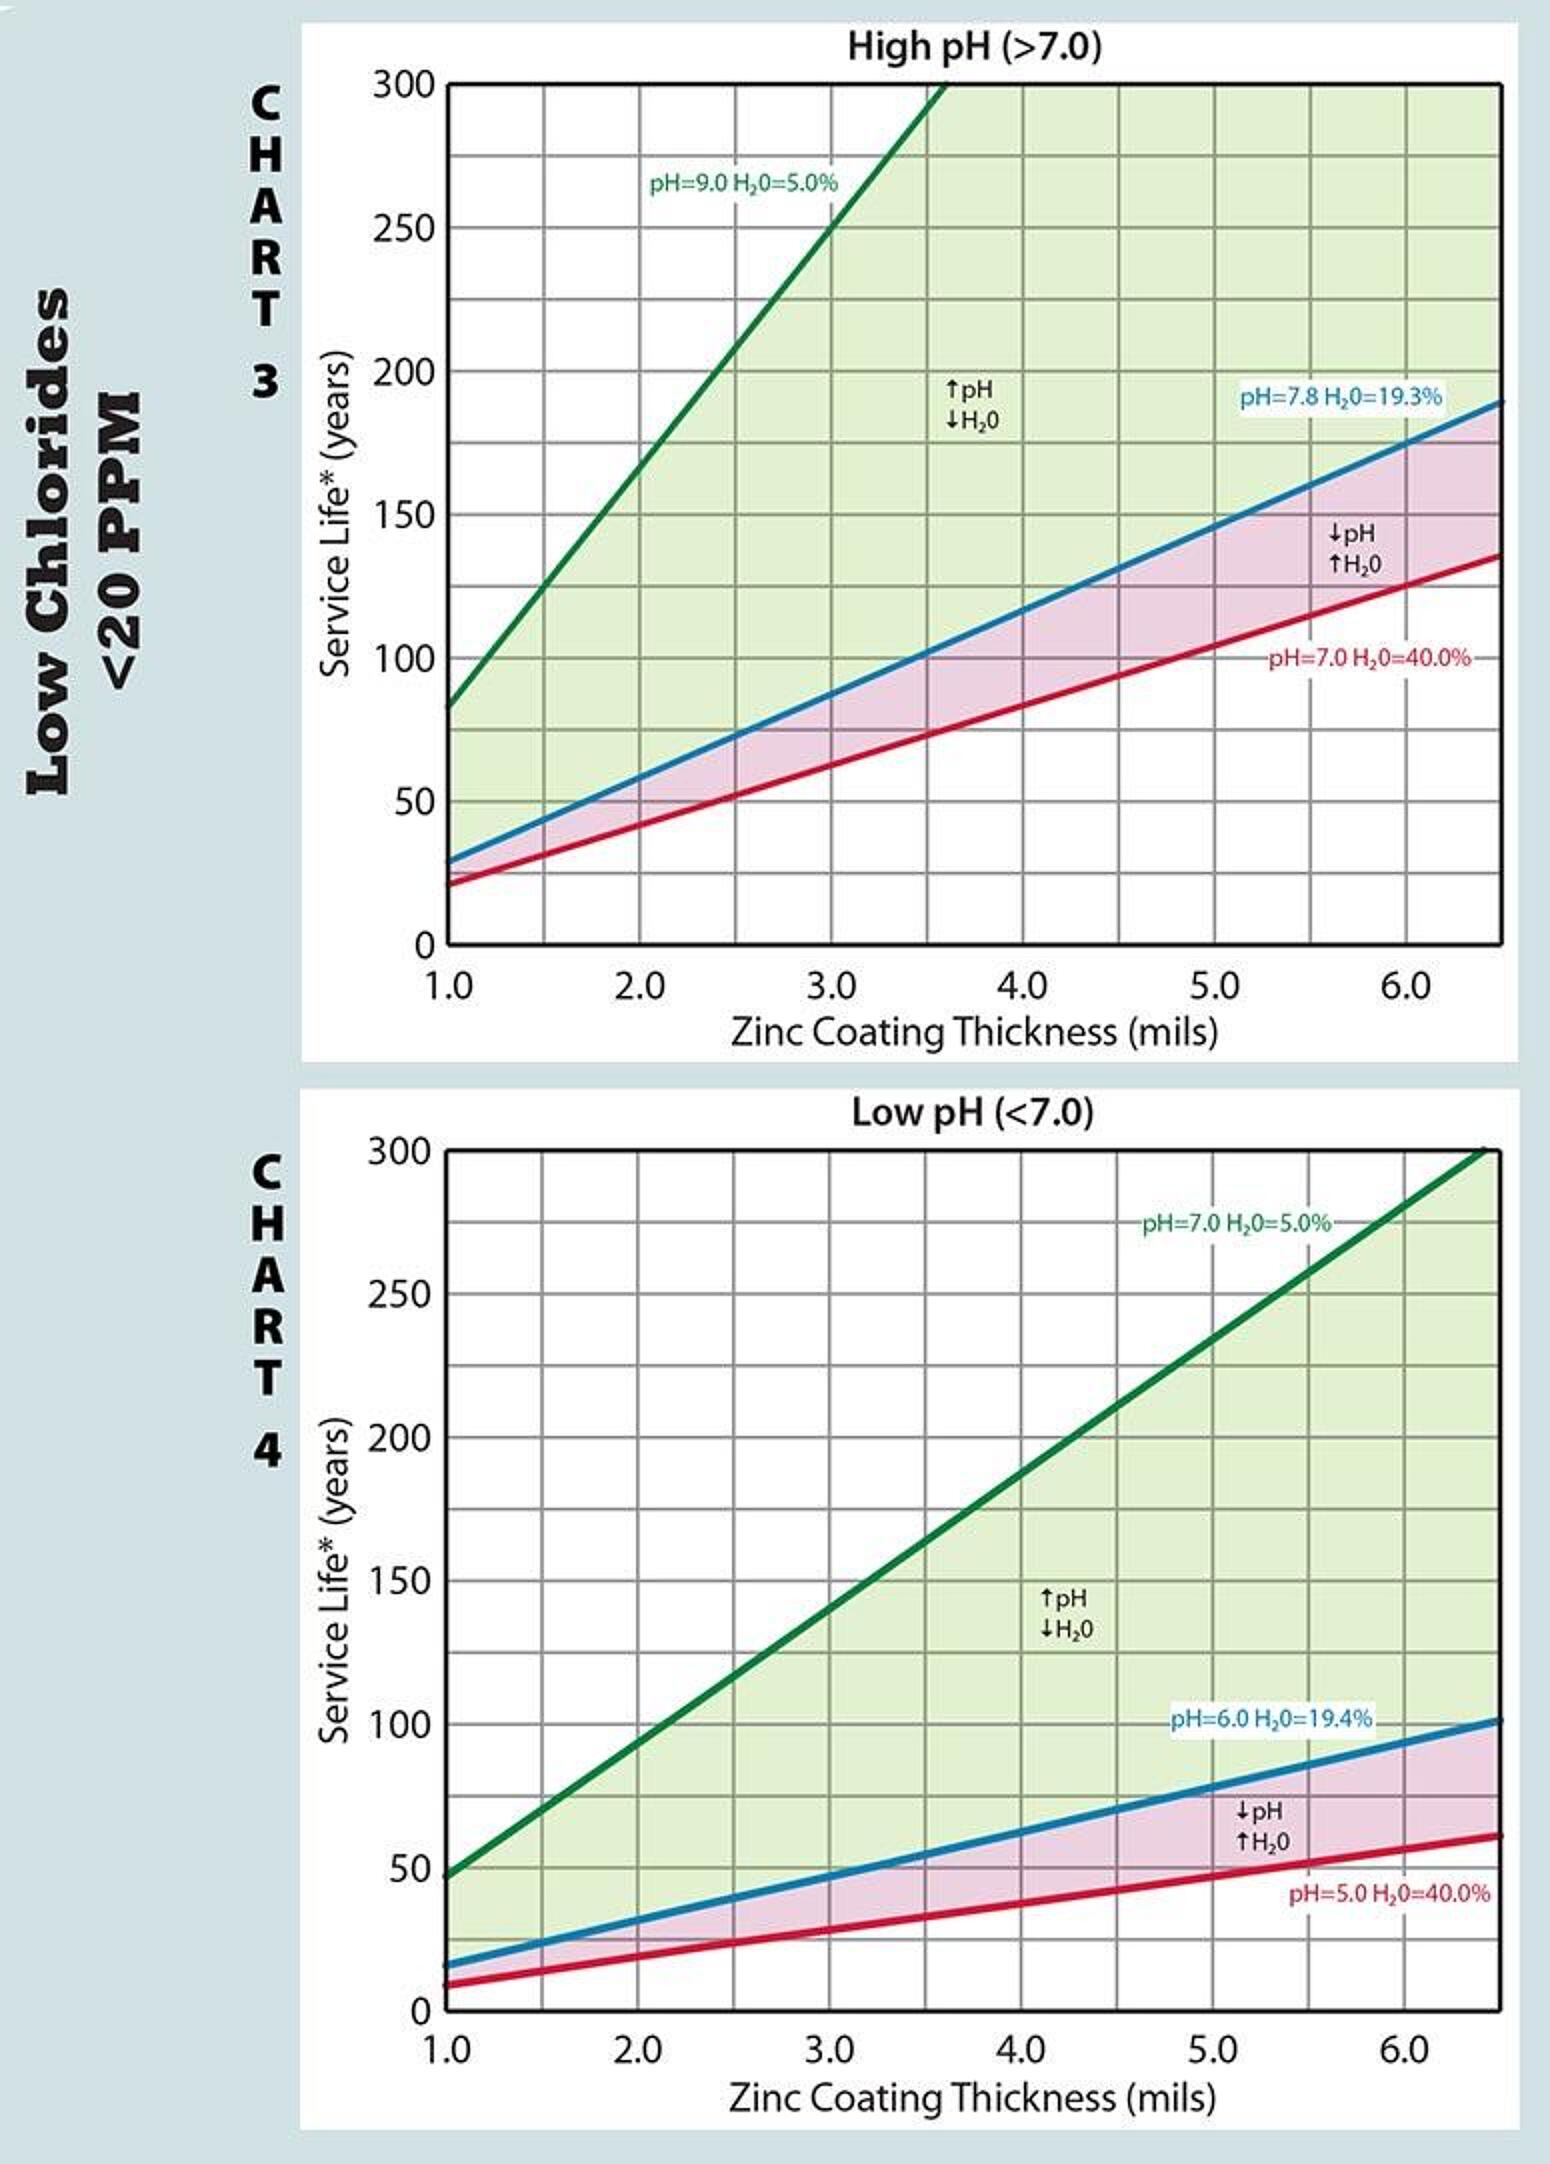
The blue line on all four charts represents the average for soils surveyed in that characteristic group. The green line represents the best soil in the category sampled, and the red line represents the worst soil in the category from the study. The shaded areas show how the changes in pH and moisture content affect the estimated service life. Assuming 3.5 mils as a minimum thickness for HDG buried in soil, the chart shows the average life in the harshest soils (uncommon) would be approximately 30 years and in the best soils exceed 120 years.
The new soil chart is based on data from two major studies. First, the Corrpro Companies study for the National Corrugated Steel Pipe Association (NCSPA) in conjunction with the American Iron and Steel Institute (AISI). The second study was done back in the 1970s by Dr. Warren Rogers which helped to determine the four variables (chlorides, moisture content, pH, and resistivity) that have the most profound effect on the corrosion rates in soils.