The Zinc Coating Life Predictor
*Updated in 2022 to reflect changes to the ZCLP website and information on updated climate data resources.
Scope
This guideline provides information and instructions for using the Zinc Coating Life Predictor (ZCLP) to accurately calculate corrosion rates of a hot-dip galvanized coating in atmospheric environments.
The ZCLP uses five different environmental parameters. The data for these parameters may be difficult to find. This guideline gives direction for locating this information and obtaining an accurate corrosion rate prediction for zinc coatings in an atmospheric environment.

Referenced Documents
- Time-to-First-Maintenance Chart
- NOAA Comparative Climatic Data Charts and Data Mapping Tool
- NOAA Normal Precipitation, Inches report
- NOAA Normal Daily Mean Temperature, °F report
- NOAA Average Relative Humidity: Morning (M), Afternoon (A) report
- National Atmospheric Deposition Program
- Canadian Climate Normals and Average Values
- US EPA National Air Quality: Status and Trends of Key Air Pollutants
- US EPA National Sulfur Dioxide Trends and map representation of the data sorted by year
- Canadian National/Regional Air Quality Indicators
- Canadian Air Quality - Average Sulfur Dioxide interactive map
The Zinc Coating Life Predictor
The American Galvanizers Association's (AGA) Time to First Maintenance (TFM) Chart approximates the usable coating protection of hot-dip galvanizing (HDG) on steel in atmospheric applications. The easy-to-use chart offers a visual representation of time to first maintenance for hot-dip galvanized steel in atmospheric exposure based on environmental conditions and zinc coating thickness. Environmental data from 25 different cities in conjunction with the Zinc Coating Life Predictor (ZCLP) were used to create the time to first maintenance vs. coating thickness lines seen on the chart. However, the chart should only be used as a tool for quick approximations and a visual interpretation of hot-dip galvanized steels time to first maintenance in accordance with the five environmental classifications commonly used by the standards organization ASTM (rural, suburban, temperate marine, tropical marine, and industrial). For a more accurate prediction of time to first maintenance, actual data for a projects specific location and climate should be collected and entered into the ZCLP model.
This model will either give a recommended zinc coating thickness based on a desired time to first maintenance, or will give an accurate estimation of time to first maintenance based on a given zinc coating thickness. This guideline gives direction on using the ZCLP as an accurate approximation tool to predict the time to first maintenance of hot-dip galvanized steel in atmospheric applications. Concrete embedment, coastal, immersion, offshore, aquatic facility, chemical exposure, galvanic corrosion, treated wood, and soil embedment applications are not represented by the ZCLP.
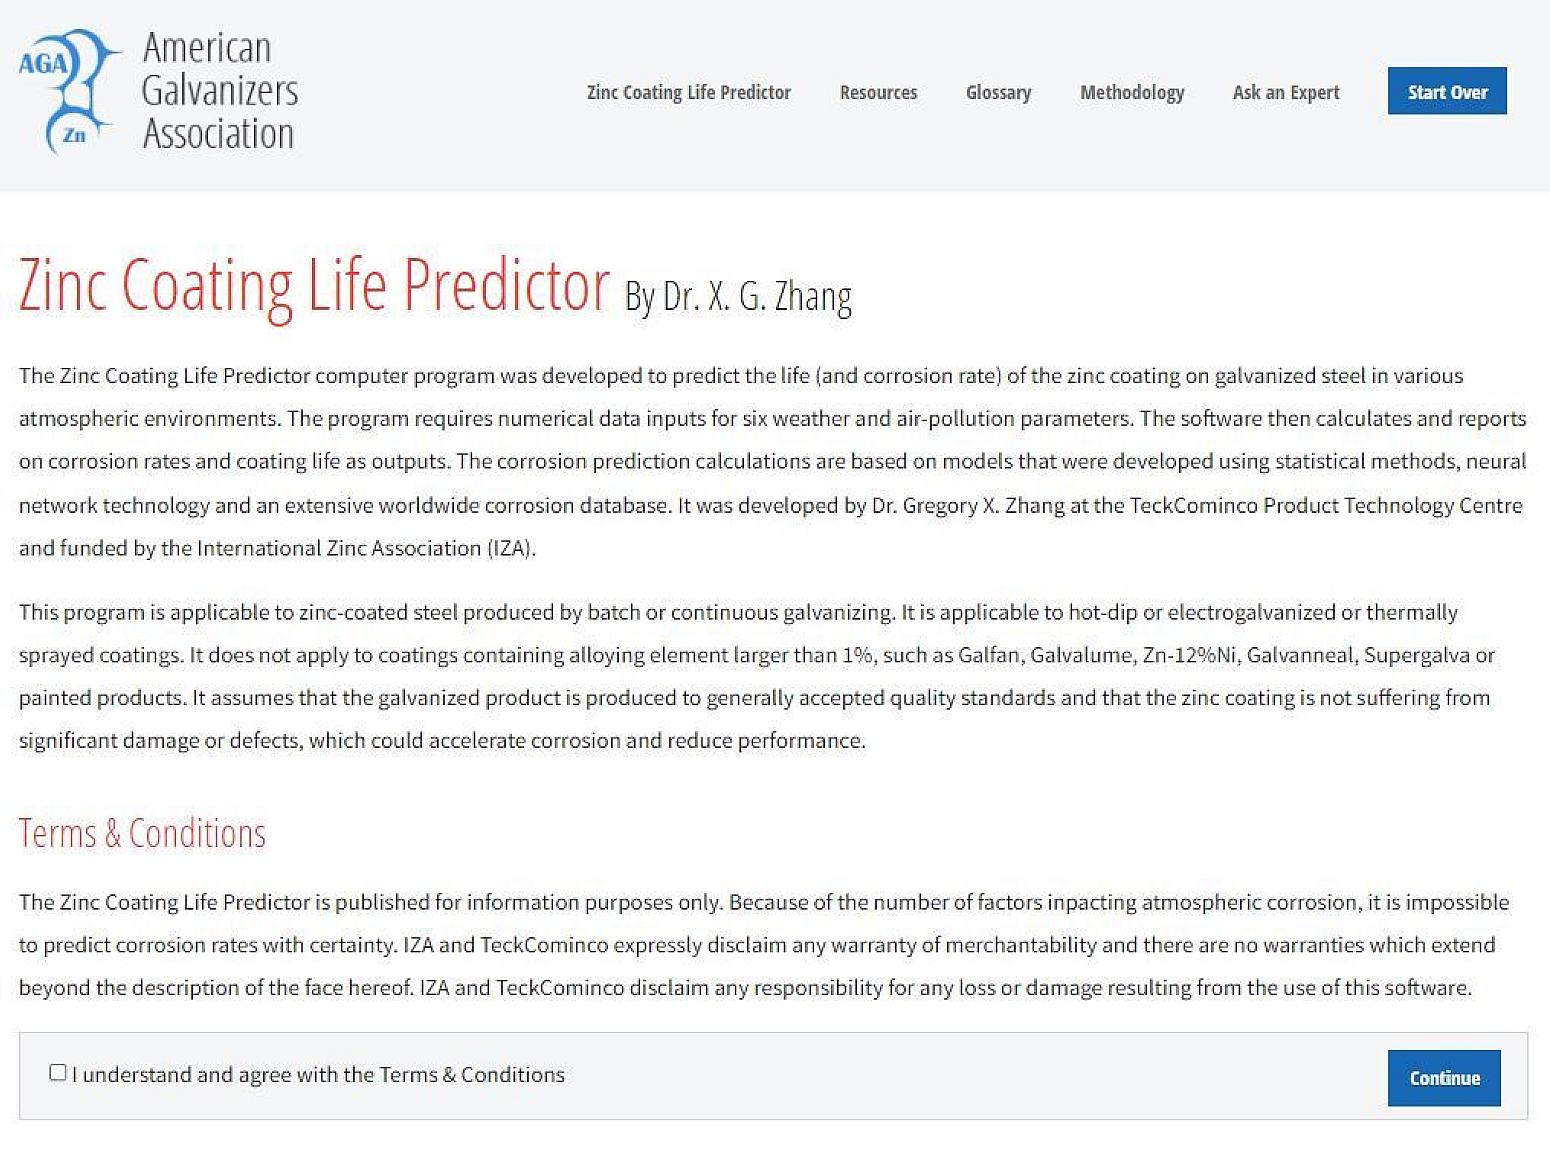
The ZCLP, an internet based tool, uses the environmental data of temperature, airborne salinity, sulfur dioxide concentration, relative humidity, rainfall, and sheltering condition, to accurately predict a time to first maintenance of hot-dip galvanized steel using a given zinc coating thickness. It is also capable of giving a coating thickness recommendation based on a desired time to first maintenance. Time to first maintenance is defined as the time between initial exposure to the atmosphere and the loss of galvanized coating until 5% of the exposed surface area shows red rusting. The software uses statistical methods, neural network technology and an extensive worldwide corrosion database to estimate corrosion rates based on the six parameters mentioned above.
Finding Data
Using the Zinc Coating Life Predictor requires one to acquire the environmental data for the six cited parameters for the particular region or project in question, and input the information into the ZCLP. From there, one can ask for a time to first maintenance based on a given coating thickness, or ask for a coating thickness based on a desired time to first maintenance.
Annual Average Climate Data
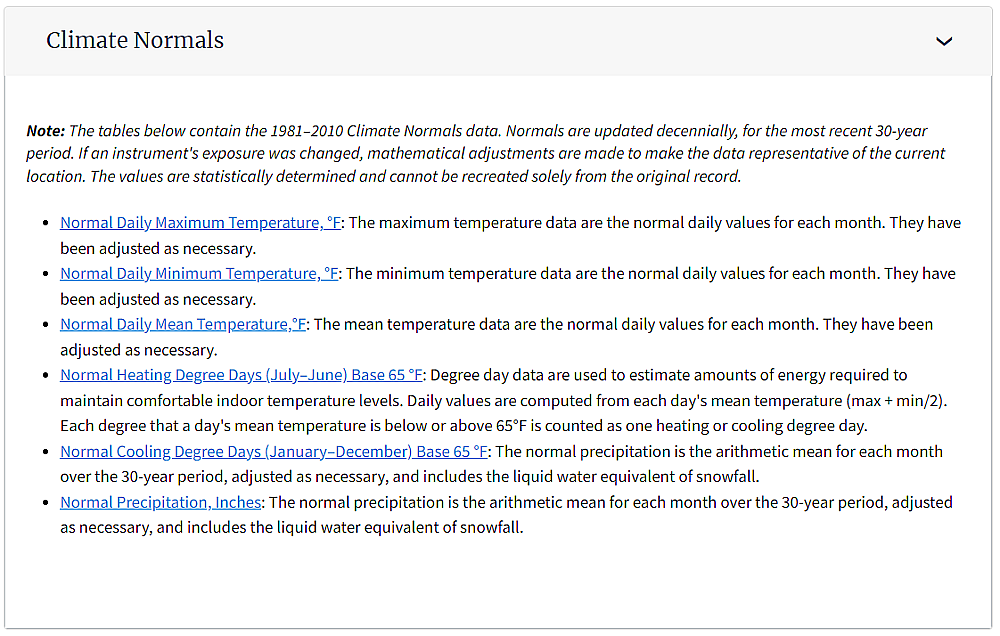
For locations in the United States of America, the National Oceanic and Atmospheric Administration, or NOAA, compiles years of climatic data from several different weather stations nationwide into the Comparative Climatic Data Charts and Data Mapping Tool. These charts provide information on the annual average of temperature, relative humidity (RH), and rain (precipitation) needed to obtain an accurate prediction for the time to first maintenance of HDG steel. Of particular interest are the following reports from NOAA:
- Normal Precipitation, Inches report and the total annual average value.
- Normal Daily Mean Temperature, °F report and the total annual average value.
- Average Relative Humidity: Morning (M), Afternoon (A) report. It is possible to use an average of the morning and afternoon annual average value.
For Canadian cities, climate normals and averages from 1981-2010 are published by the Government of Canada by city, province, territory or proximity to a known location. No additional data has been published since 2010.
Sulfur Dioxide (SO2) Deposition
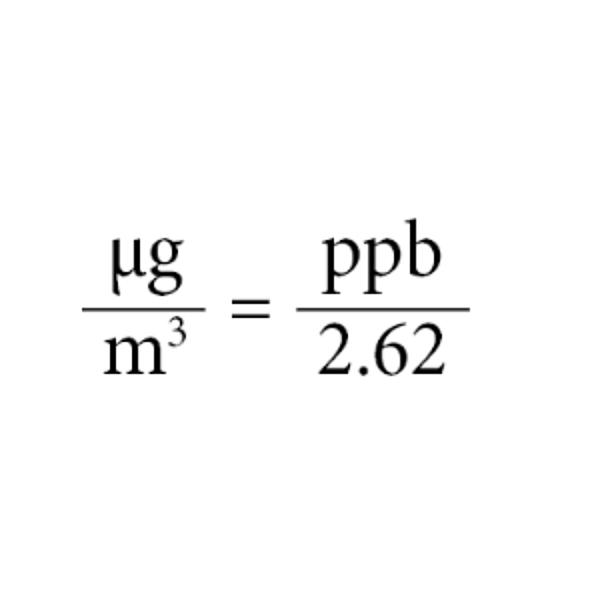
For the US, general trends for SO2 concentrations in parts per billion are provided by region from the US Environmental Protection Agency (EPA) for general regions. EPA also provides a map representation of the data sorted by year. Additional information may also be available from the National Atmospheric Deposition Program. US data points prior to 2006 do not reflect sweeping changes in fuel regulations demonstrated a noticeable impact to deposition rate trends and more recent data will lead to more accurate results.
The Canadian government collects average annual SO2 values in parts per billion for general regions. See published table “Number of stations selected for the national and regional air quality indicators. The most recent data is from 2016. Average sulfur dioxide data for each collection site is also available in interactive map form (Air Quality – Average Sulphur Dioxide).
Air Salinity
For rural areas without the pollution from traffic or industrial settlements a value less than 5 mg/m2/day can be used for the Cl concentration. In urban and industrial locations, contact the municipality or state federal environmental federal agencies. Cl content in the air is not always monitored.
Project Example - Tappan Zee Bridge
Working through a step-by-step example here will best explain how to use this valuable tool. We will use the specific example of the atmospherically exposed hot-dip galvanized steel of the Tappan Zee bridge spanning the Hudson River in New York. The Zinc Coating Life Predictor is accessed at zclp.galvanizeit.org. Accepting the terms and conditions and selecting the "continue" button will lead you to the model for input of project-specific climate data.
Yearly Average Rainfall (Precipitation) - NY
Rain or Precipitation is the first parameter needed by the ZCLP. The CCD website provides a report on the average rainfall information under "Climate Normals" called Normal Precipitation, Inches. Here we are interested in the total annual average value. This report contains tables of data arranged by meteorological elements, with weather stations listed alphabetically by state.
After locating the state of New York, you will notice it has nine weather stations to choose from. A quick look at a map will tell you the "NEW YORK Central Park,NY" is the closest listed station to the Tappan Zee Bridge (about 25 miles). The Precipitation chart within the CCD arranges precipitation data for each station by rainfall per month, per year, and the number of years represented by the data. Here, we are only interested in the total annual average (the last column "ANN") and find it is 49.94 inches for the Tappan Zee Bridges climate. This number is entered into our model and inch/year is selected on the drop-down menu next to rainfall to give the correct units.
Yearly Average Relative Humidity (%RH) - NY
Relative Humidity is another parameter needed by the ZCLP. The CCD website provides a report on the average Relative Humidity under "Observed Data" called Average Relative Humidity: Morning (M), Afternoon (A). Again, for the Tappan Zee Bridge we use the C.Park NY weather station. The Relative Humidity chart within the CCD gives values for average relative humidity in both the morning and the afternoon for every month of the year and an annual average of this data. For the purpose of the ZCLP, we use an average of the annual morning (ANN M = 70) and annual afternoon data (ANN A = 54) for "NEW YORK Central Park,NY" weather station. These are represented in the last two columns of the table. The average of the morning and afternoon annual values is 62% RH and will represent the relative humidity parameter for the ZCLP.
Yearly Average Temperature - NY
Temperature is another important factor for the corrosion rate of hot-dip galvanized steel in atmospheric conditions. In this case, we look for the daily mean temperature of the climate in question. The CCD website provides a report on daily mean temperature under "Climate Normals" called Normal Daily Mean Temperature, °F. Similar to the precipitation and relative humidity data, we are looking for the annual average value the closest weather station to the Tappan Zee Bridge ("NEW YORK Central Park,NY") represented by the last column (ANN) and we find the value is 54.9 degrees Fahrenheit. This is input into our model making sure the correct units of Fahrenheit or Celsius are selected before moving on.
Sulfur Dioxide - NY
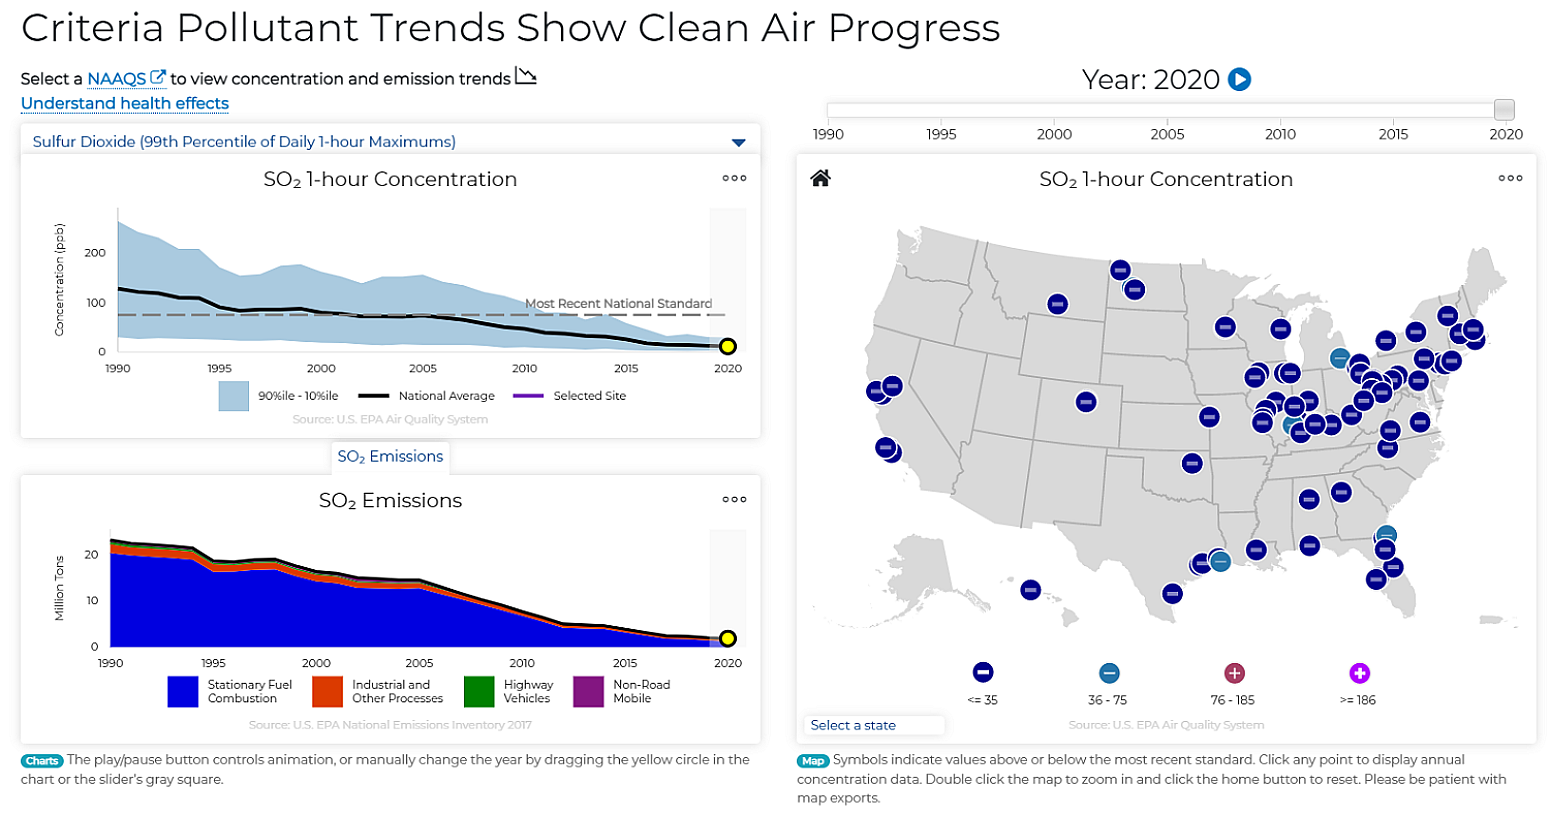
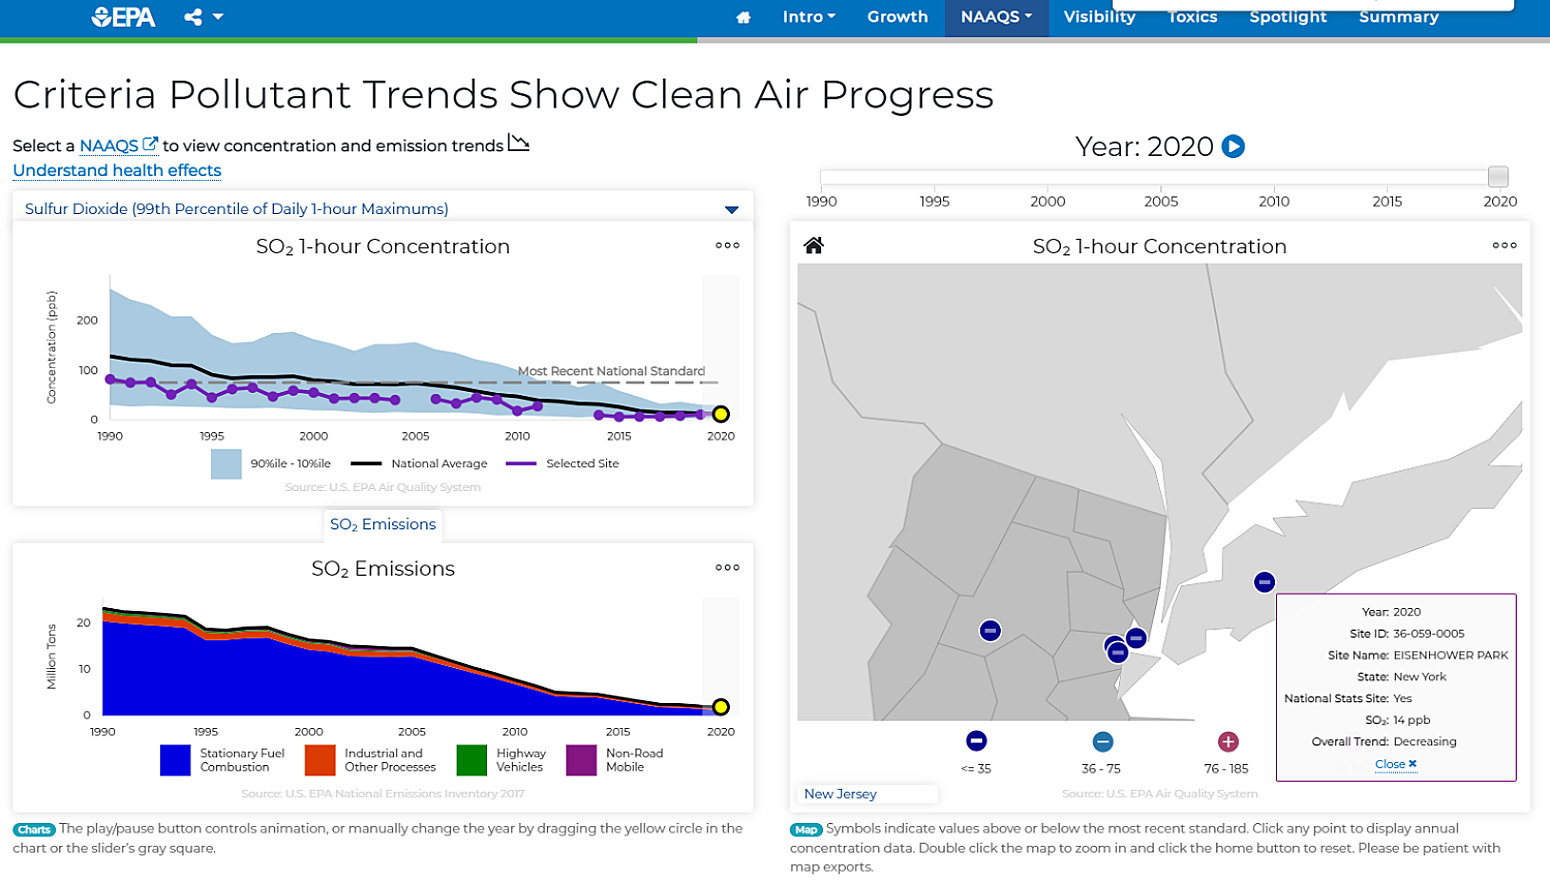
Sulfur Dioxide can either be measured by the deposition rate onto surfaces, or by the concentration of the pollutant in the air. For our purposes we will use the air concentration value. The Environmental Protection Agency (EPA) monitors air quality, including sulfur dioxide content, at several stations around the United States. Their website on NAAQS Trends contains a drop down menu on the top left chart, where you can select "Sulfur Dioxide 99th percentile of Daily 1-hr Maximums." Afterward, click on the menu in the bottom left corner of the US map image to select New York State. Zoom in in on the map to the Tappan Zee Bridge will show locations marked by a pin, where SO2 data is taken. SO2 levels (in ppb) for a number of years are available as well as trends in SO2 levels to help make predictions for future corrosion rates. There is also an option to download the data from this graph and view it on an Excel spreadsheet.
These steps were followed for the Tappan Zee Bridge area and it was found that the SO2 levels for this area are about 14 ppb or 5.34 micrograms per cubic meter. This value is entered into our model, making sure we change the units in the right drop down menu to μg/m3.
Air Salinity - NY
Salinity deposition is a measurement of the salt deposited per surface area on a daily basis.
| Environment | Salinity (mg/m2*day) |
| Rural | 5 |
| Suburban | 5-10 (Depending of Proximity to Sea) |
| Temperate Marine | 25 |
| Tropical Marine | 30 |
| Industrial | 5-25 (Depending on Proximity to Sea) |
Table 1: Salinity Based on Environment
This is the parameter with the least readily available information. For developing the Time to First Maintenance Chart, the AGA used estimations for this value based on real world data and distance from the sea. Areas closer to the sea have a higher salinity deposition rate than areas further away from a body of salt water. Table 1 shows some average salinity rates used for the making of the Time-to-First-Maintenance Chart based on the type of climate. These values can be used as an approximation. We now determine that the Tappan Zee Bridge is located in an Industrial Environment with very close proximity to the sea and use the value of 25 mg/m2 per day. This value is then input into the ZCLP.
Sheltering Condition of Project
Sheltering Condition is up for interpretation for each individual project. One is able to pick from the choices of Open Air, Rain Sheltered, or Indoor. Rain sheltered conditions are considered to still be an outdoor application, but with some protection from rain and other weather elements. The Tappan Zee Bridge stands over the Hudson River with no sheltering. Therefore, for this parameter we say the hot-dip galvanized steel is in an open air condition and choose this option from the drop down menu to the right.
Using Results
Now that we have found the data needed for the ZCLP to make a prediction, it may all be entered into the ZCLP and a time to first maintenance prediction can be made.
Table: Inputs for Tappan Zee Bridge Projects
Yearly Average Rainfall | 49.94 inches |
Yearly Average Relative Humidity | 62% RH |
Yearly Average Temperature | 54.9 degrees Fahrenheit |
Sulfur Dioxide (SO2) Deposition | 5.34 μg/m3 |
Air Salinity | 25 mg/m2 per day |
Sheltering Condition | Open Air |
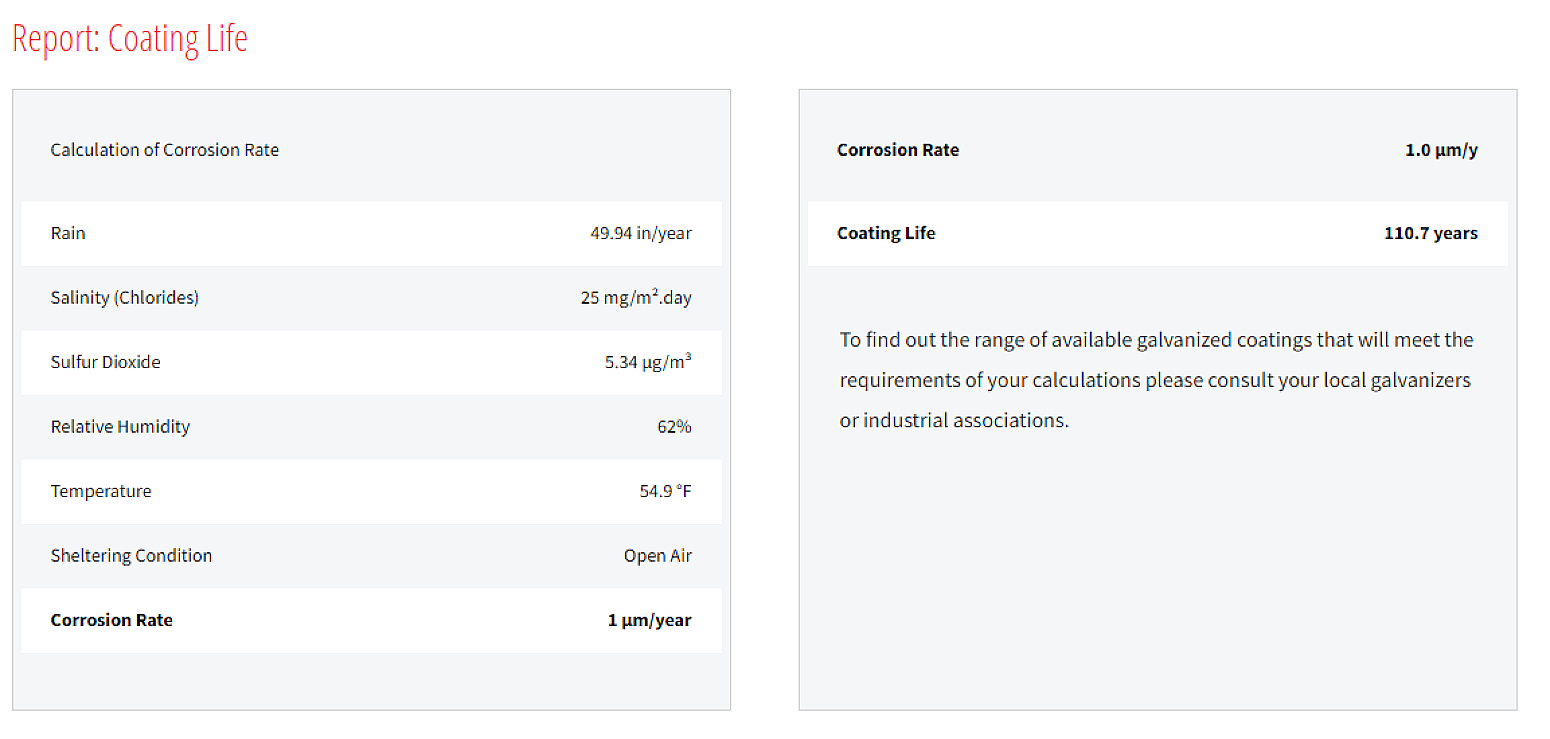
After the data above has been entered and the correct units have been selected (Figure 5), clicking on the Continue button leads us to a new screen (Figure 6) with options for predicting the life of the coating based on a determined thickness, or for determining what thickness of coating is needed to last a determined amount of time.


Calculate Coating Life will predict the amount of time it will take for zinc coating to degrade based on the factors previously entered and the specified coating thickness. ASTM A123 specifies a minimum coating thickness of 3.9 mils (100 micrometers) for thicker structural steel pieces like those used in the construction of the Tappan Zee Bridge. Here, we will enter this minimum specified thickness into the ZCLP. Keeping in mind, however, that this is only a minimum thickness required and the actual measured thickness may be greater than this value. When this coating thickness is input into the ZCLP with the correct units selected, and Calculate Life is clicked on, a new page (Figure 7) appears with a readout of corrosion rate and predicted coating life.
For the Tappan Zee Bridge, the rate of corrosion is predicted at 1µm/yr (0.04 mils/year) with a coating life of 110.7 years.
Calculate Coating Thickness, located at the bottom right-hand side of the page will predict the coating thickness needed to last a specified amount of time based on the environmental factors previously specified. As an example, we can say the desired design life of the Tappan Zee Bridge is 75 years. This time can be entered into the ZCLP; also keeping in mind that this is only the amount of time it will take for the initial coating to corrode away. With minor touch up and repair of the coating at this time, the steel will be protected years beyond this point. Seventy five years is input into the ZCLP, Calculate Coating Thickness is clicked on, and the model leads us to a new screen (Figure 8).
The corrosion rate is predicted at 1µm/yr (0.04 mil/yr) with a coating thickness of 67.9µm (2.67 mils) needed to provide corrosion protection the Tappan Zee Bridge for 75 years.

© 2025 American Galvanizers Association. The material provided herein has been developed to provide accurate and authoritative information about after-fabrication hot-dip galvanized steel. This material provides general information only and is not intended as a substitute for competent professional examination and verification as to suitability and applicability. The information provided herein is not intended as a representation or warranty on the part of the AGA. Anyone making use of this information assumes all liability arising from such use.
