HDG Corrosion Rates for ISO Categories C1-C5/X

Why does the AGA Time to First Maintenance Chart not use ISO 9223 Corrosion Categories?
The Time to First Maintenance (TFM) Chart was developed from real world data and a corrosion prediction model called the Zinc Coating Life Predictor (ZCLP). The atmospheric corrosion rate data was collected from galvanized steel samples exposed to the five defined environments in locations around North America and then coupled with the statistical methods and neural network technology of the ZCLP.
The TFM chart is intended to provide a quick visual representation of atmospheric corrosion rates in North America. Concrete embedment, coastal, immersion, offshore, aquatic facility, chemical exposure, galvanic corrosion, treated wood, and soil embedment applications are not represented by this chart.
Five environmental classifications commonly used by the standards organization ASTM (rural, suburban, temperate marine, tropical marine, and industrial) are used to describe the corrosion rate curves of the TFM chart. These environmental classifications with respect to North America are different than the categories of corrosivity C1-C5/X used by the International Standards Organization (ISO) and specifically the category classification system for metals and alloys according to the standard ISO 9223:2012
(see Tables 1 and 2).
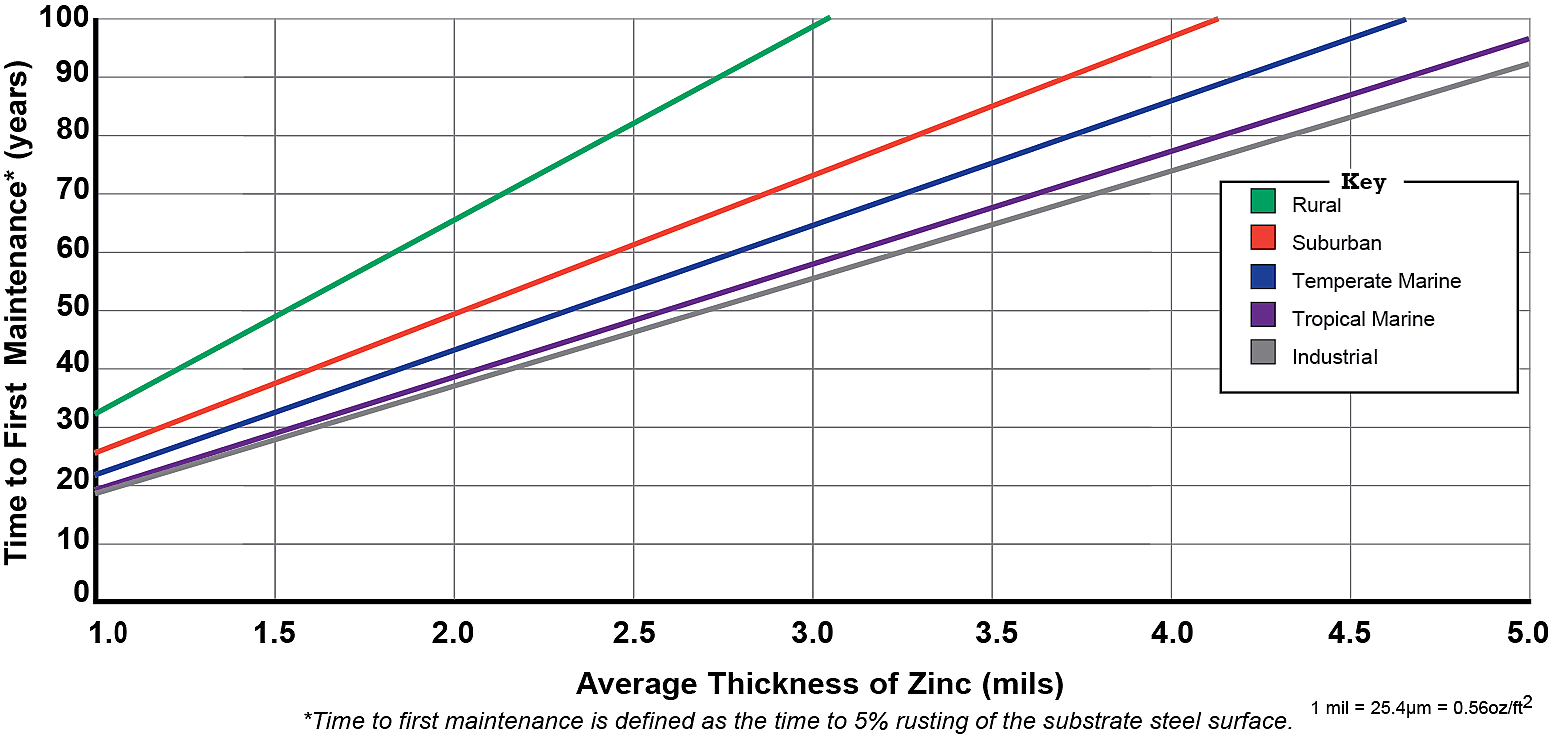
Five cities from different geographical regions were selected to represent each ASTM environmental classification (Table 1). Predicted corrosion rates were then averaged to represent environmental classifications and then used to develop each curve. These data points are based on macroscopic environmental data and, thus, may vary from the actual corrosion rate observed, due to site-specific environmental conditions.
Table 1: Categories of Corrosivity of the Atmosphere for AGA Time to First Maintenance (TFM) Chart
| TFM Environment Classification |
Avg Zn Corrosion Rate per ZCLP [µm per year] |
Avg Zn Corrosion Rater per ZCLP [mils per year] |
Equivalent ISO Corrosion Category for Zinc |
City Corrosion Data Used to Create the TFM Curve |
|---|---|---|---|---|
| Rural | 0.75 | 0.030 | C2/C3 | Boise, ID; Las Cruces, NM; Fargo, ND; Little Rock, AK; Macon, GA |
| Suburban | 1.00 | 0.040 | C3 | Vallejo, CA; Tucson, AZ; Cedar Rapids, IA; Jackson, MS; Harrisburg, PA; Columbia, SC |
| Temperate Marine | 1.15 | 0.045 | C3 | Seattle, WA; San Francisco, CA; Milwaukee, WI; Norfolk, VA; Atlantic City, NJ; Boston, MA |
| Tropical Marine | 1.26 | 0.050 | C3 | Miami, FL; Corpus Christi, TX; San Diego, CA; Cancun, Mexico; Mazatlan, Mexico |
| Industrial | 1.32 | 0.052 | C3 | Pocatello, ID; Los Angeles, CA; Chicago, IL; Dallas, TX; New York, NY; Knoxville, TN |
In North America and especially the United States, Table 1 demonstrates most of the atmospheric corrosion environments do not exceed the ISO C3 category classification despite a colloquial description matching those of a higher ISO category (Table 2). For example, many people describe the Florida coast as a “Tropical Marine” environment, but the actual observed corrosion rate measurements fall into the range provided for an ISO C3 category classification.
In this sense, the ISO C3 category classification is considered very broad in terms of corrosion rates observed. ISO category classification C3 has a defined corrosion rate for zinc between 0.7 and 2.1 µm per year (0.028 and 0.083 mils per year). If we consider a typical minimum coating thickness for hot-dip galvanized coatings on structural steel (100 µm or 3.9 mils), articles placed in an environment classified as ISO C3 could experience a time to first maintenance between 47 to 143 years. This range may be significant to specifiers evaluating sustainable construction materials or developing long-term corrosion mitigation strategies. Tools like the TFM chart and the ZCLP are designed to help you make an educated decision about the wide range of corrosion rates that are practically observed within this range. In summary, this is why the environment classifications of the TFM chart fall mostly within the ISO C3 category classification and are not equivalent (in name) to the ISO category classifications provided in Table 2.
Should you need to estimate atmospheric corrosion rates for zinc in an environment that can be classified as ISO C1, C4, C5, or CX, you can use the ZCLP if you have collected the necessary environmental data to use the model. Otherwise, for a general indication of corrosion rates (conservatively based upon one year exposures) you can refer to Table C.1 of ISO standard 9223. A summary of the ISO category classification descriptors and associated corrosion rates are provided in Table 2.
Table 2: Categories of Corrosivity of the Atmosphere According ISO 9223
| General Description |
Typical Outdoor Environment | Corrosivity | Corrosion Rate [µm per year] based upon 1-yr exposures |
Corrosion Rate [mils per year] based upon 1-yr exposures |
|
|---|---|---|---|---|---|
| C1 | Desert | Dry or cold zone, very low pollution and time of wetness, e.g. certain deserts, Central Artic/Antarctica | Very Low | <0.1 | <0.004 |
| C2 | Rural | Temperate zone (dry or cool) with minimal pollution (SO2 < 5 µg/m3), short time of wetness, e.g. rural areas, subarctic areas, some arid and desert areas, small villages or towns | Low | 0.1 - 0.7 | 0.004 - 0.028 |
| C3 | Urban | Temperate zone with medium pollution (SO2 > 5 to ≤ 30 µg/m3) or some effect of chlorides, e.g. urban areas, between 1-30 km (depending on prevailing winds, buildings, vegetation and topography) from the ocean, or within 100 m of sheltered coastal areas with low chloride deposits | Medium | 0.7 - 2.1 | 0.028 - 0.083 |
| C4 | Industrial | Temperate, subtropical to tropical, low to high pollution (SO2 >30 to ≤ 90 µg/m3) or substantial chloride effect, e.g. < 1 km of the ocean or within 100 m of sheltered coastal areas and outside the splash zone of salt water | High | 2.1 - 4.2 | 0.082 - 0.165 |
| C5 | Marine | Subtropical to tropical, periods of time of wetness, very high industrial pollution (SO2 90 to ≤ 250 µg/m3) or significant chloride effect/deposits, e.g. industrial polluted areas, jetties and offshore structures, within a few hundred meters of the ocean and certain exposed areas along the coastline | Very High | 4.2 - 8.4 | 0.165 - 0.331 |
| CX | Offshore | Subtropical to tropical, extended time of wetness, very high industrial pollution (SO2 >250 µg/m3) or significant and extended chloride effect/deposits, e.g. highly industrialized and polluted areas, jetties and offshore structures, within a few hundred meters of the ocean with extended periods of on-shore prevailing winds and certain exposed areas along the coastline and within the splash zone of salt water | Extreme | 8.4 - 25 | 0.331 - 0.984 |
© 2026 American Galvanizers Association. The material provided herein has been developed to provide accurate and authoritative information about after-fabrication hot-dip galvanized steel. This material provides general information only and is not intended as a substitute for competent professional examination and verification as to suitability and applicability. The information provided herein is not intended as a representation or warranty on the part of the AGA. Anyone making use of this information assumes all liability arising from such use.