In Soil/At Ground Level
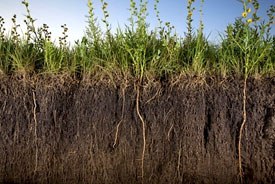
At ground level, corrosion mechanics of HDG are less defined than in atmospheric exposure. Soil may be piled up against the support structure of a bridge or highway sign and alternately removed and/or grass and weeds may grow up around the steel, abrade it, decay around the base, and remain moist. The corrosive elements in this environment can be very unpredictable and it doesn't really follow the rules of exposure in the atmosphere or in soil rather, somewhere in between. Galvanized steel's abrasion resistance and impervious barrier protection ensure it can perform in this transitionary environment.
Soil Performance
Hot-dip galvanized steel performance in soil is varied and hard to predict. For highway products, mass transit line infrastructure, and especially for mechanically stabilized earth, it is common for hot-dip galvanized steel elements to be in contact with the soil. For all of these items, structural integrity below grade is very important, but also difficult, if not impossible to inspect for corrosion.
The main factors that dictate the corrosivity of the soil are moisture content, pH level, and chlorides. These soil conditions are affected by additional characteristics of the soil such as aeration, temperature, resistivity, and texture or particle size. A general rule of thumb is galvanizing performs well in brown sandy soils, and not as well in gray, clay-like soils. This is because soil with larger particles wick moisture away from the surface more quickly so the galvanized piece has less exposure to moisture.
In order to predict the performance of hot-dip galvanized steel in soil, you must first classify the soil. And as the corrosion rate of steel in soil can range from less than 0.2 microns per year in favorable conditions, to 20 microns per year or more in very aggressive soils, misclassifying the soil can lead to unpredicted performance.
The AGA has developed a new chart for estimating HDG's performance in soil based on real-world corrosion data. Service life as defined by the chart is total consumption of the coating plus 25% and is an indication of when the structure should be replaced. There are four different charts based on the characteristics of the soil.
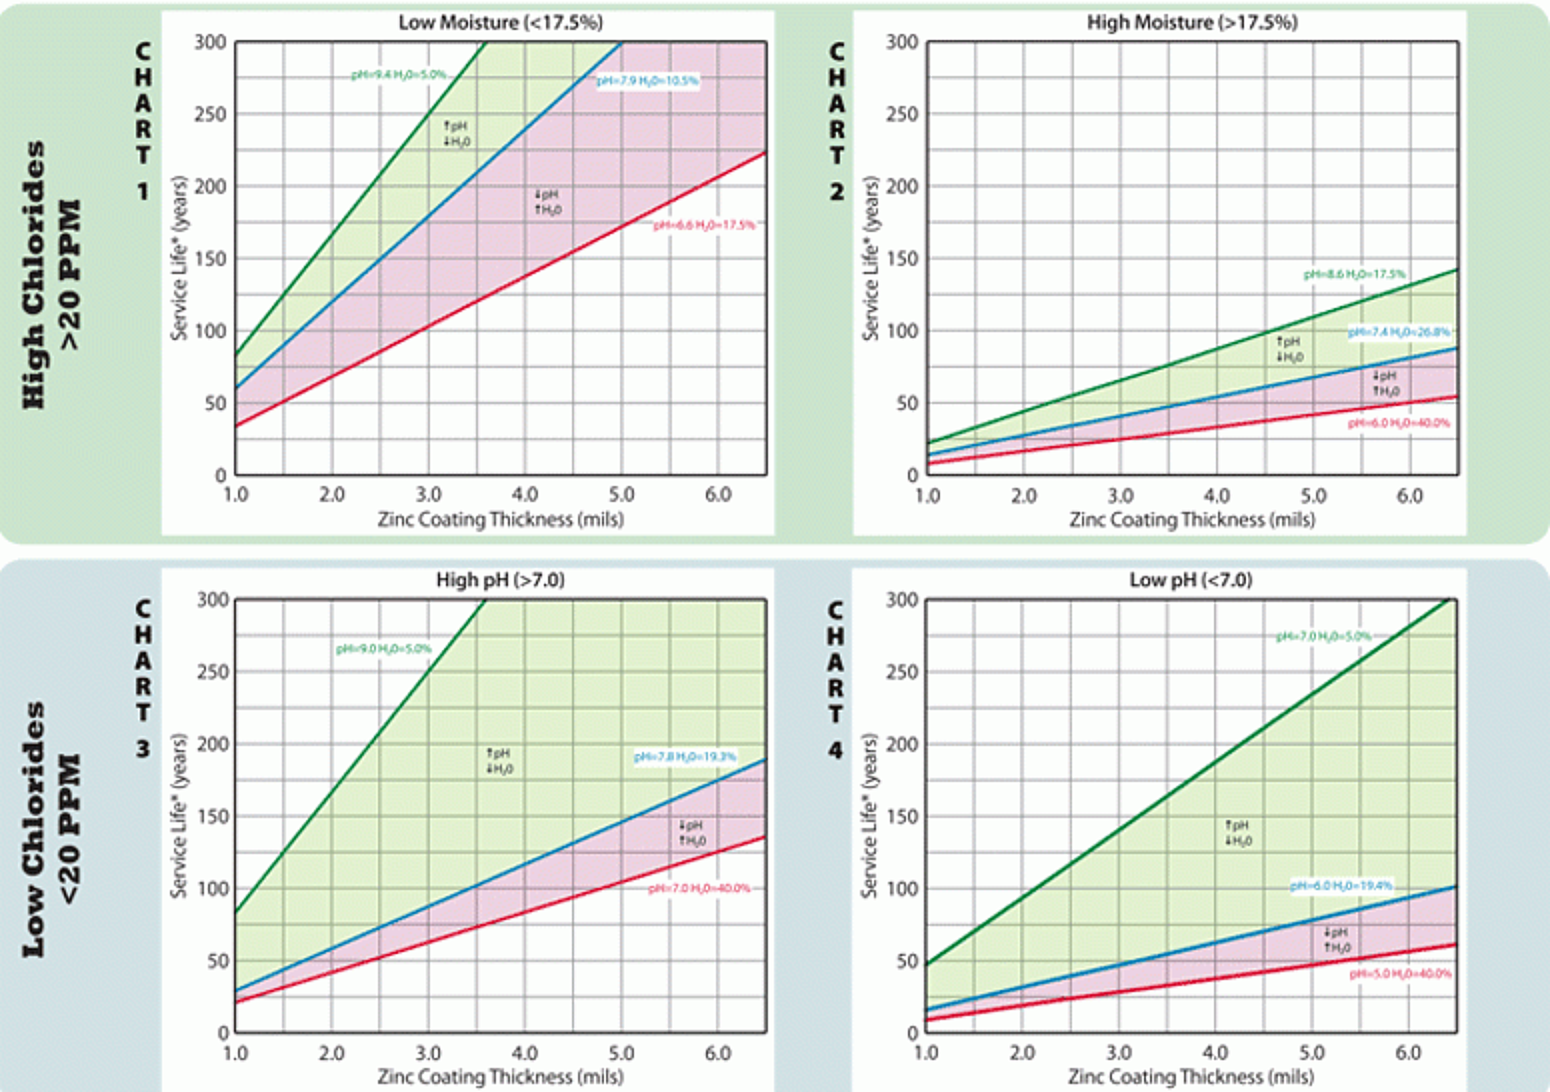
To use the chart, you must first classify the soil by chloride content. Charts 1 and 2 are used for soils with high chlorides (>20 PPM) and Charts 3 and 4 are used for soils with low chlorides (<20 PPM). Once you have identified the chloride content, there is a second classification to determine the correct chart to use. For soils with high chlorides, the second determination would be moisture content. Soils with low moisture (<17.5%) fall on Chart 1, while soils with high moisture (>17.5%) fall on Chart 2. For low chlorides, the second determination is the pH level. Soils with high pH levels (>7.0) fall on Chart 3, while soils with low pH (<7.0) fall on Chart 4.
The blue line on all four charts represents the average for soils surveyed in that characteristic group. The green line represents the best soil in the category sampled, and the red line represents the worst soil in the category of the study. The shaded areas show how the changes in pH and moisture content affect the estimated service life. Assuming 3.5 mils as a minimum thickness for HDG buried in soil, the chart shows the average life in the harshest soils (uncommon) would be approximately 30 years and in the best soils exceed 120 years.