Time to First Maintenance
For nearly a century, independent and industry testing of samples in five environments (industrial, rural, suburban, tropical marine, and temperate marine) have yielded real-world performance data for hot-dip galvanized steel. Using this real-world corrosion data, statistical methods, and neural network technology, Dr. Gregory Zhang of Teck Metals Ltd. Developed the Zinc Coating Life Predictor (ZCLP) to estimate the life of hot-dip galvanized coatings in atmospheric conditions. Using the ZCLP, you can input specific parameters for any environment and get an estimated time to first maintenance (TFM) for the galvanized coating.
Atmospheric Exposure
The combined efforts of barrier, cathodic, and zinc patina protection translate into long-lasting, maintenance-free corrosion protection. To determine exactly how long your project will last, maintenance-free, you can consult the Time to First Maintenance chart. This chart was developed using the Zinc Coating Life Predictor, and predicts the galvanized coating’s protective life within the five atmospheric environments defined by ASTM International.
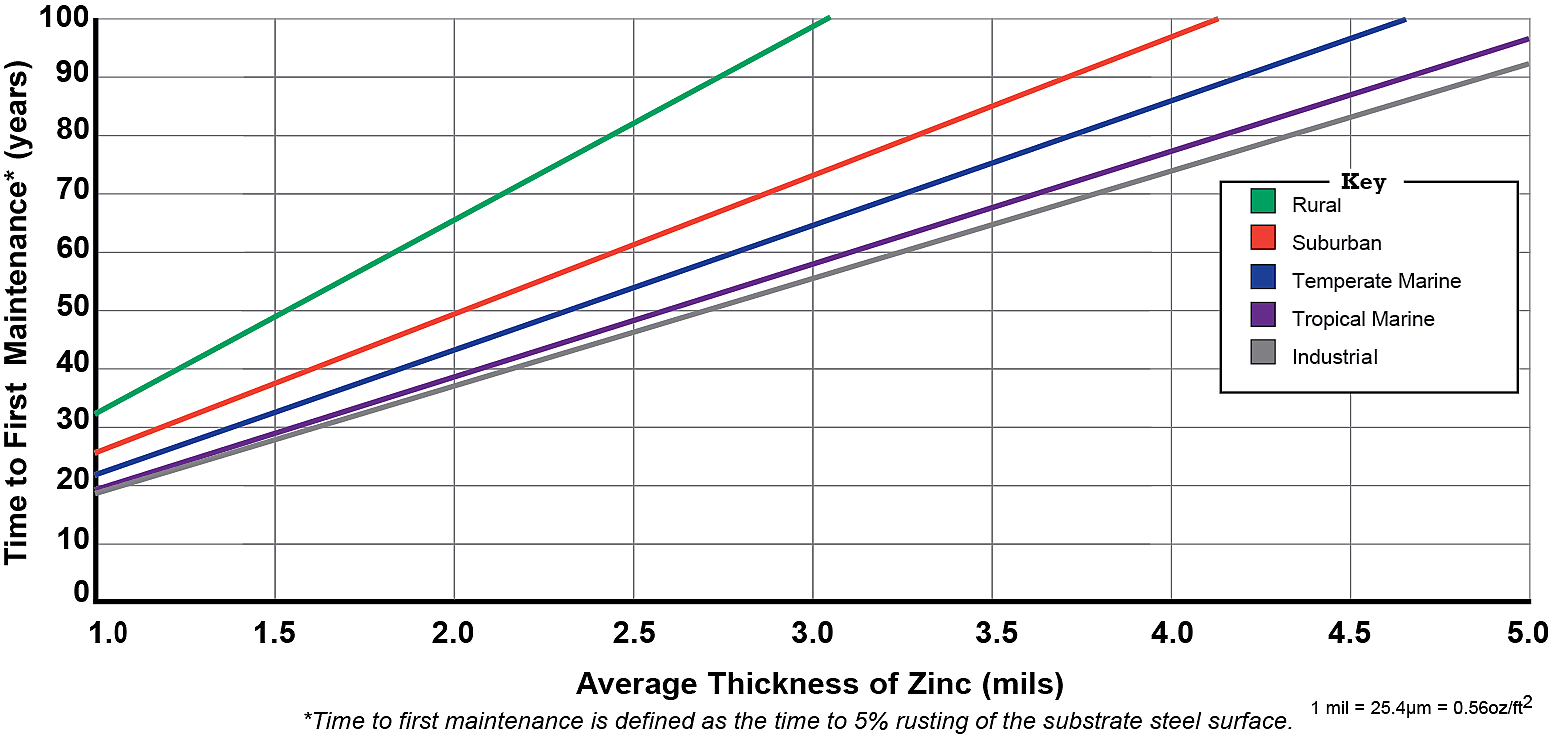
A galvanized coating’s protective life is determined primarily by the thickness of the coating and the severity of the exposure conditions in each environment. Following the chart, let’s say you have a galvanized structure in an industrial environment with a coating thickness of 4 mils. If you follow the 4.0 mils up the gray industrial environment line and across, you’ll see you have approximately 72 years until first maintenance (or 5% rust of the substrate steel).
Longevity Case Study
Johnson & Johnson Solar Panels, New Brunswick, NJ 2006
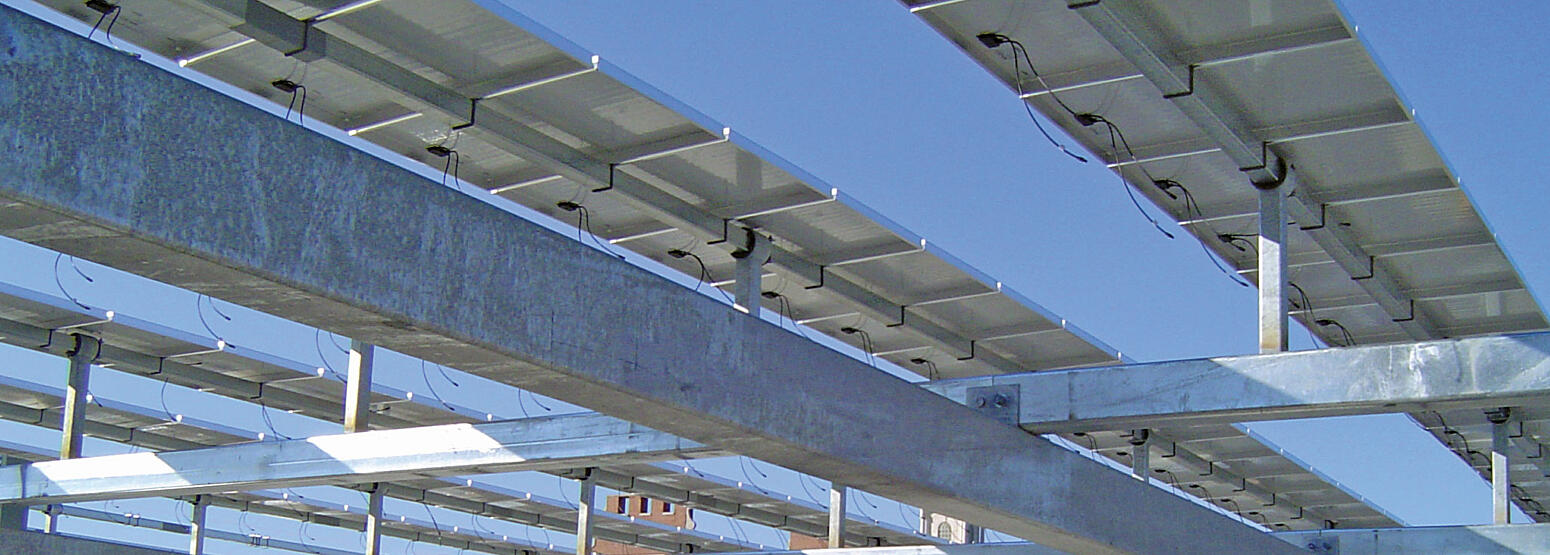
Johnson & Johnson desired a coating that would withstand the harsh New Brunswick winters with little future maintenance of the solar panel system erected on the roof of a multi-level parking garage. Powerlight Corp. has installed many solar panel systems, and thoroughly recognizes the benefits of galvanized steel because of the unmatchable track record in previous projects.
With Johnson & Johnsons desire for longevity and low maintenance and Powerlight Corps past experience with the product, hot-dip galvanized steel was the logical choice. The hot-dip galvanized structural framing, tube steel supports, and brackets will be able to withstand the harsh elements of the climate as well as the rigors of vehicle emissions. The roof structure is highly visible from street level and blends nicely with the concrete substructure and surrounding environment.
With the alternative power market expanding steadily, this project will help propel hot-dip galvanizing as an important component in this growing market. The virtually Maintenance-free coating of hot-dip galvanizing will quietly but consistently protect the solar roof panel system so it can be enjoyed today and tomorrow alike.
Soil Exposure
The first step to estimating the performance of hot-dip galvanized steel in soil is to classify it. And as the corrosion rate of steel in soil can range from less than 0.2 microns per year in favorable conditions, to 20 microns per year or more in very aggressive soils, misclassifying the soil can lead to unpredicted performance. The AGA has developed a chart for estimating HDG’s performance in soil based on real world corrosion data. In this case, service life is defined as total consumption of the coating plus 25% and is an indication of when the structure should be replaced.
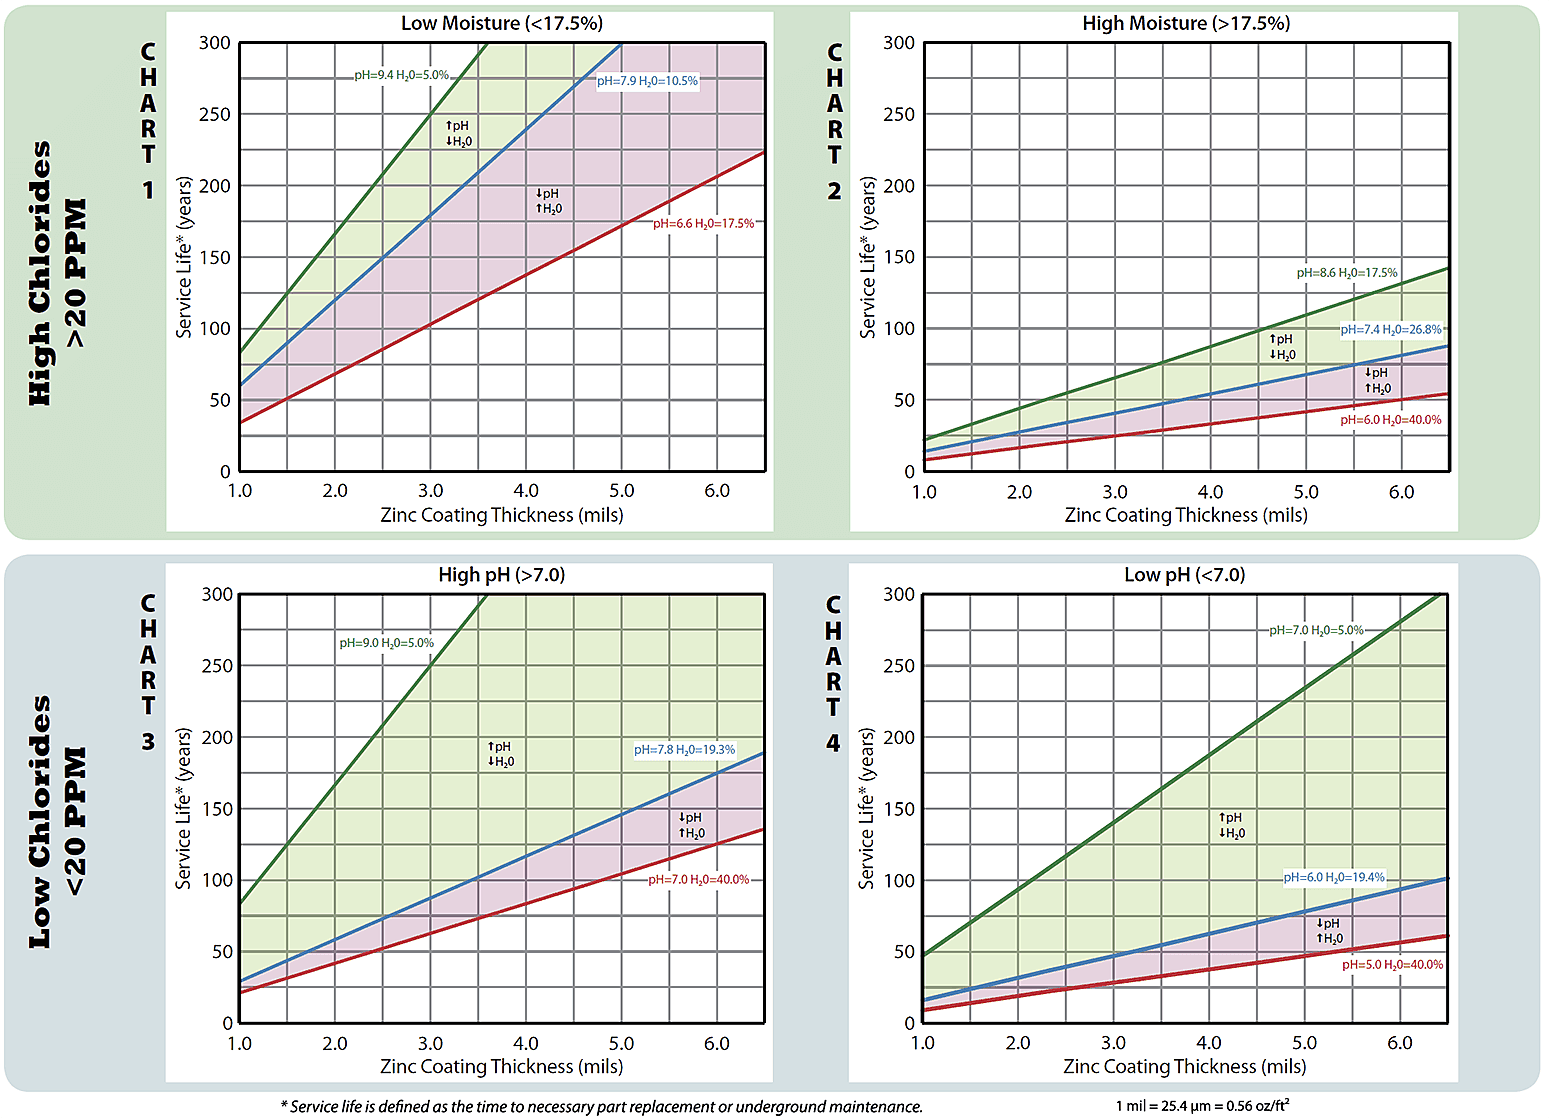
The first parameter is chloride content – Charts 1 and 2 (top row) are used for soils with high chlorides (>20 PPM) and Charts 3 and 4 (bottom row) are used for soils with low chlorides (<20 PPM). Once you have identified the chloride content, there is a second classification narrow down to the final chart. For soils with high chlorides, the second determination would be moisture content. Soils with low moisture (<17.5%) fall on Chart 1, while soils with high moisture (>17.5%) fall on Chart 2. For low chlorides, the second determination is the pH level. Soils with high pH levels (>7.0) fall on Chart 3, while soils with low pH (<7.0) fall on Chart 4.
Once you are looking at the correct chart, the blue line represents the average for soils surveyed in that characteristic group, while the green line represents the best soil and the red line represents the worst soil in the category. The shaded areas show how the changes in pH and moisture content affect the estimated service life. Assuming 3.5 mils as a minimum thickness for HDG buried in soil, the chart shows the average life in the harshest soils (uncommon) would be approximately 50 years and in the best soils exceed 120 years.
Keep in mind unlike the atmospheric chart which shows time to first maintenance, this chart is predicting full service life (total zinc consumption + 25%) aka time to replacement.