EPDs for Hot-Dip Galvanizing
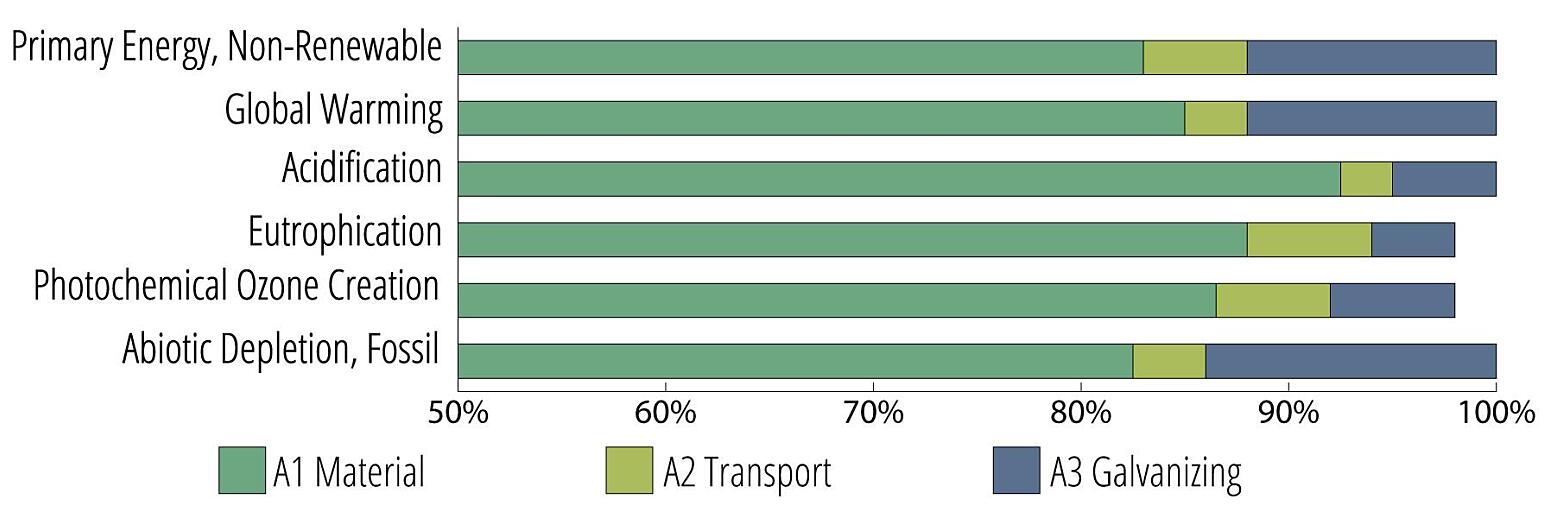
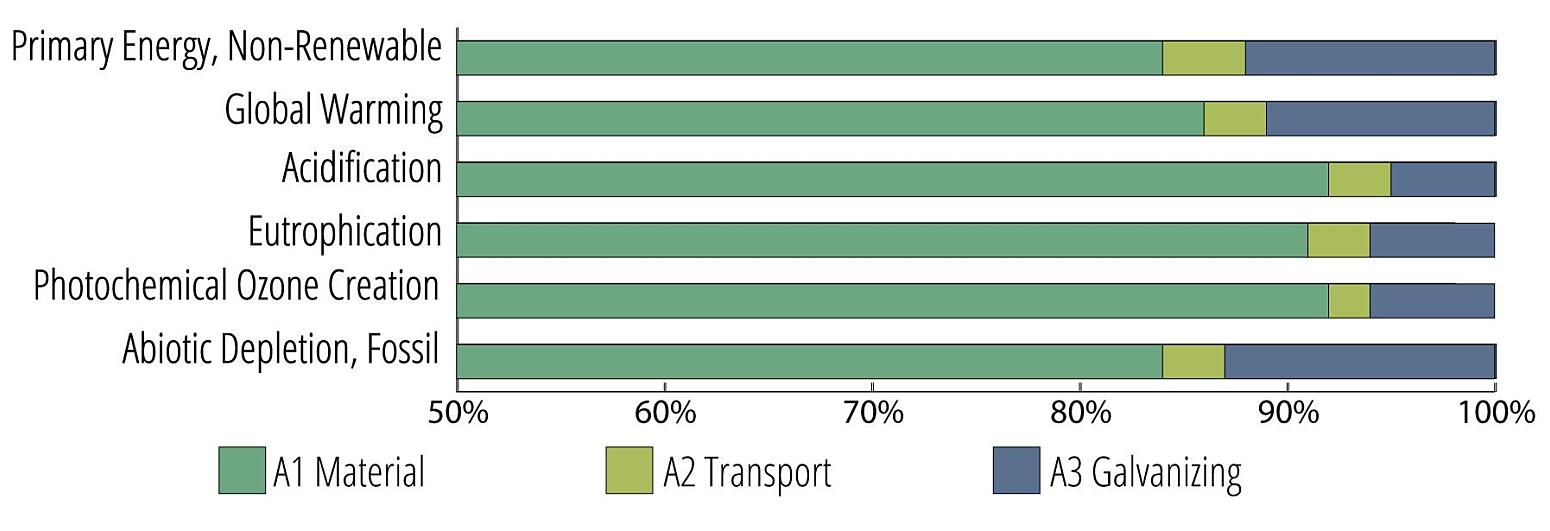
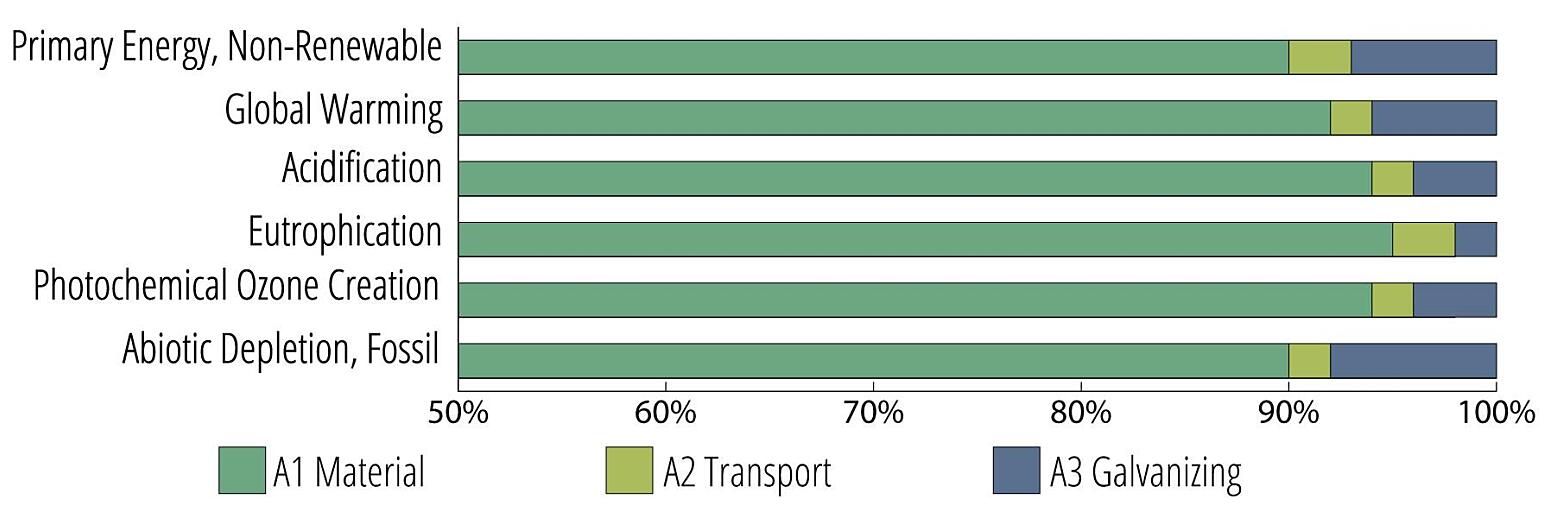
The AGA published three different EPDs, one for hot-rolled structural sections, plate, and hollow structural sections (HSS). All three used the same data for A2, A3 (galvanizing), and D (recycling credit), as the raw material and energy input and emission outputs are an average of applying the galvanized coating. The only differences in the products is from A1, as the steel making and fabrication requirements vary for each type of steel.
| Structural Sections (A1-A3 Total) | Plate (A1-A3 Total) | HSS (A1-A3 Total) | Recycle Credit (D) | |
|---|---|---|---|---|
| Renewable Primary Energy | 1,010 MJ | 991 MJ | 1,230 MJ | -60.3 MJ |
| Non-Renewable Energy | 18,700 MJ | 22,200 MJ | 31,200 MJ | -162 MJ |
| Total Energy | 19,700 MJ | 23,200 MJ | 32,400 MJ | -222 MJ |
| Use of Secondary Materials (mt) | 1.02 mt | 0.81 mt | 0.07 mt | 0 mt |
| Radioactie Waste | 0.00876 mt | 0.000804 mt | 0.000579 mt | -0.0000147 mt |
| Materials for Recycling | 0.0205 mt | 0.0205 mt | 0.0205 mt | 0 mt |
| GWP (CO2) | 1.48 kg | 1.79 kg | 2.68 kg | -0.0156 kg |
| AP (SO2) | 0.00728 kg | 0.00728 kg | 0.0100 kg | -0.000117 kg |
| EP (N) | 0.000216 kg | 0.00029 kg | 0.000509 kg | -0.00000702 kg |
| POCP (O3) | 0.0586 kg | 0.0892 kg | 0.143 kg | -0.00266 kg |
| ADPf | 16,500 MJ | 20,000 MJ | 29,600 MJ | -125 MJ |
Looking at all three products input and output flows using the US EPAs TRACI 2.1 methodology, the EPD shows the overall impact of the galvanizing process is minimal in comparison to the raw materials supply. In each of the three products, the hot-dip galvanized coating application accounts for no more than 15% of the total energy or impact, and in the case of HSS, the HDG is no more than 10%. To view the full EPD, please visit galvanizeit.org/epd.